Learn to organize and analyze time-based data in Power BI with the date hierarchy feature. This guide covers the benefits and provides a step-by-step process to create a date hierarchy, enhancing your data analysis from years to minutes.
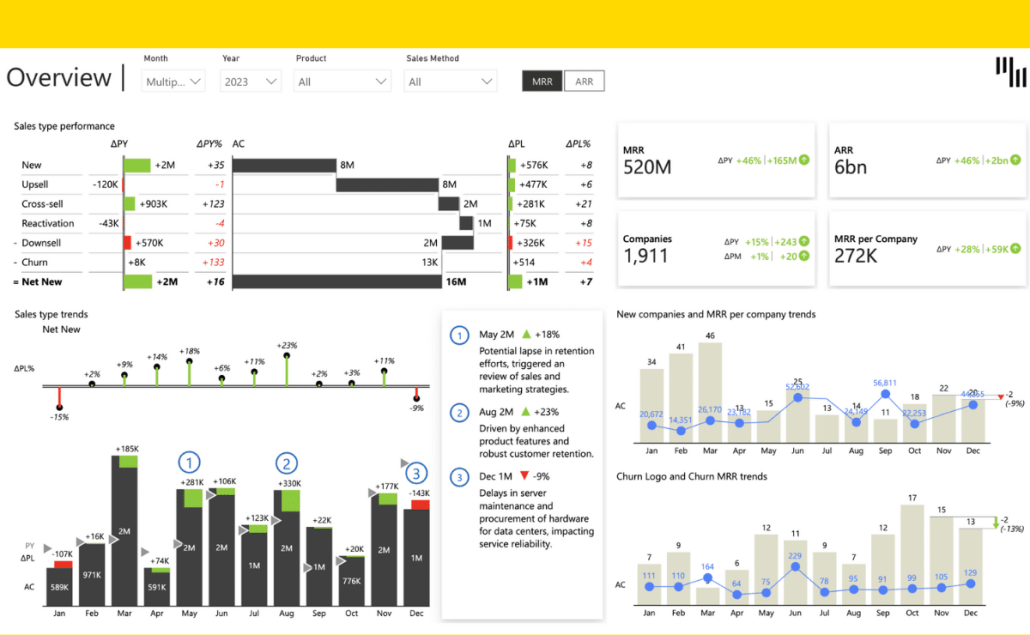
Quickly understand your sales trends with the Zebra BI SaaS Sales Power BI Dashboard. This dashboard provides instant insights into MRR, sales by type, and manager performance, helping you make informed decisions fast.
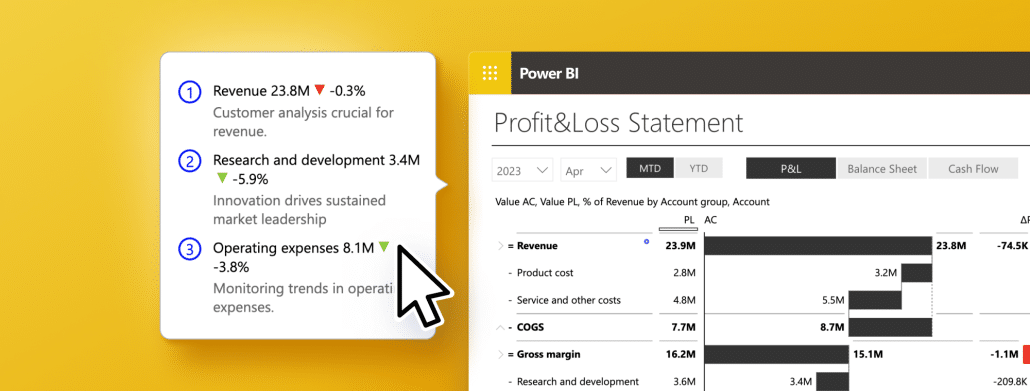
Find out why you should include comments in Power BI reports to deliver clear context and insights, which will help you make informed and strategic decisions.
 September 8th
 February 22nd