What is an Income Statement
An income statement — sometimes called a profit and loss statement (P&L) — is a financial report that shows a company's revenues, expenses, and profits or losses over a specific period (like a month, quarter, or year).
It answers the question: "Did the business make money or lose money during this time?"
Who is this income statement template for?
- Finance professionals and controllers – to analyze actual performance historically and validate forecasting assumptions about future performance
- FP&A teams – for building dynamic dashboards that replace static Excel financial statements and outdated financial dashboards
- Executives and senior management – to get high-level and drill-down financial views
- Business managers and non-financial users – to understand how their actions impact financial outcomes
- Data analysts and BI developers – looking to elevate financial reporting with best-in-class visuals
Whether you’re in consumer goods, manufacturing, retail, or services—anyone looking to understand revenue drivers will benefit from this report.
Basic structure of an Income Statement
Although there may be variations from one organization to another, the basic structure of an income statement is as follows:
- Revenue (how much money came in)
- Cost of Goods Sold (COGS) (direct costs of making products or services)
- Gross Profit (Revenue - COGS)
- Operating Expenses (like salaries, rent, marketing)
- Operating Income (Gross Profit - Operating Expenses)
- Other Income/Expenses (interest, investments, etc.)
- Net Income (final profit or loss after everything)
You can also check our Financial Statement Cheat Sheet here, if you need some help jumpstarting the creation of your Financial Statement.
What business insights will this Income Statement template give you?
The Income Statement report helps you answer critical business questions related to a number of verticals:
✅ Profitability
- Are we generating a net profit or operating at a loss?
- What is our operating profit margin, and is it improving?
- How do our profit levels compare to the previous period or industry benchmarks?
- Are certain segments or products more profitable than others?
- How well do actuals align with plans and forecasts?
✅ Revenue Trends
- Is our revenue growing steadily over months or years?
- Are there seasonal patterns or anomalies in our sales income?
- Which product lines or regions are contributing the most to revenue growth?
- Are we retaining customers or relying heavily on new sales?
- What are the main drivers behind our income growth or decline?
- Which business area, which region, what has impacted your topline?
✅ Cost Management
- Which expense categories are growing the fastest?
- Are we maintaining healthy cost-to-revenue ratios?
- Can we identify areas of unnecessary or redundant spending?
- Are our cost structures scalable as revenue grows?
- Are your operating expense ratios on track?
- Do we have any expense budget left?
✅ Gross Margin Analysis
- Are our margins healthy enough to support long-term operations?
- Are there pricing or cost-of-goods issues reducing our margins?
- How do gross margins vary across different product lines or services?
- Are input costs (materials, labor) eroding our profitability?
✅ Operational Efficiency
- Are we controlling our fixed and variable operating costs effectively?
- Is our revenue growth outpacing our administrative expenses?
- Are we achieving economies of scale?
- Are there areas where automation or process improvements could reduce costs?
✅ Net Income Trends
- Is our net income growing consistently?
- How volatile is our profitability quarter to quarter?
- Are external factors (e.g., taxes, interest) significantly impacting our bottom line?
- Are profit trends aligned with revenue and cost trends?
- What does the statement by region look like?
- Which parts of the income statement need more attention and why?
- What are the trends in key metrics like EBITDA or Net Income?
✅ Break-even Awareness
- How much revenue do we need monthly to cover all fixed and variable costs?
- How close are we to our break-even point this quarter?
- What impact do pricing changes have on our break-even point?
- How does break-even differ by product, service, or business unit?
✅ Strategic Decision Making
- Do we have the financial strength to expand or enter new markets?
- Can we afford to increase headcount or marketing spend?
- Are we generating enough profit to reinvest in innovation or technology?
- Are our financials strong enough to attract investors or secure loans?
Why use this template
This Power BI example is designed to showcase best-practice data visualization techniques for income statements and other key financial reports.
It enables you to:
- Communicate key financial metrics—like revenue, gross profit, and net income—clearly and efficiently using built-in variance visualizations
- Use visual storytelling to make complex financial statements understandable at a glance—even for non-finance stakeholders
- Avoid writing complex DAX formulas by leveraging automatic variance calculations, integrated comments, and on-the-fly custom calculations
- Build advanced financial visuals like waterfall charts, bridge charts, and small multiples in just a few clicks with Zebra BI visuals
Whether you’re preparing reports for executives or performing detailed financial analysis, this template ensures your financial story is accurate, impactful, and easy to understand—so your data truly drives better business decisions.
Zebra BI Charts & Tables used
For this Income Statement dashboard in Power BI, we have brought together the most suitable Zebra BI charts and tables to help you accurately assess financial performance in a more effective way, focused on clarity of insights and ease of use.
Zebra BI Charts:
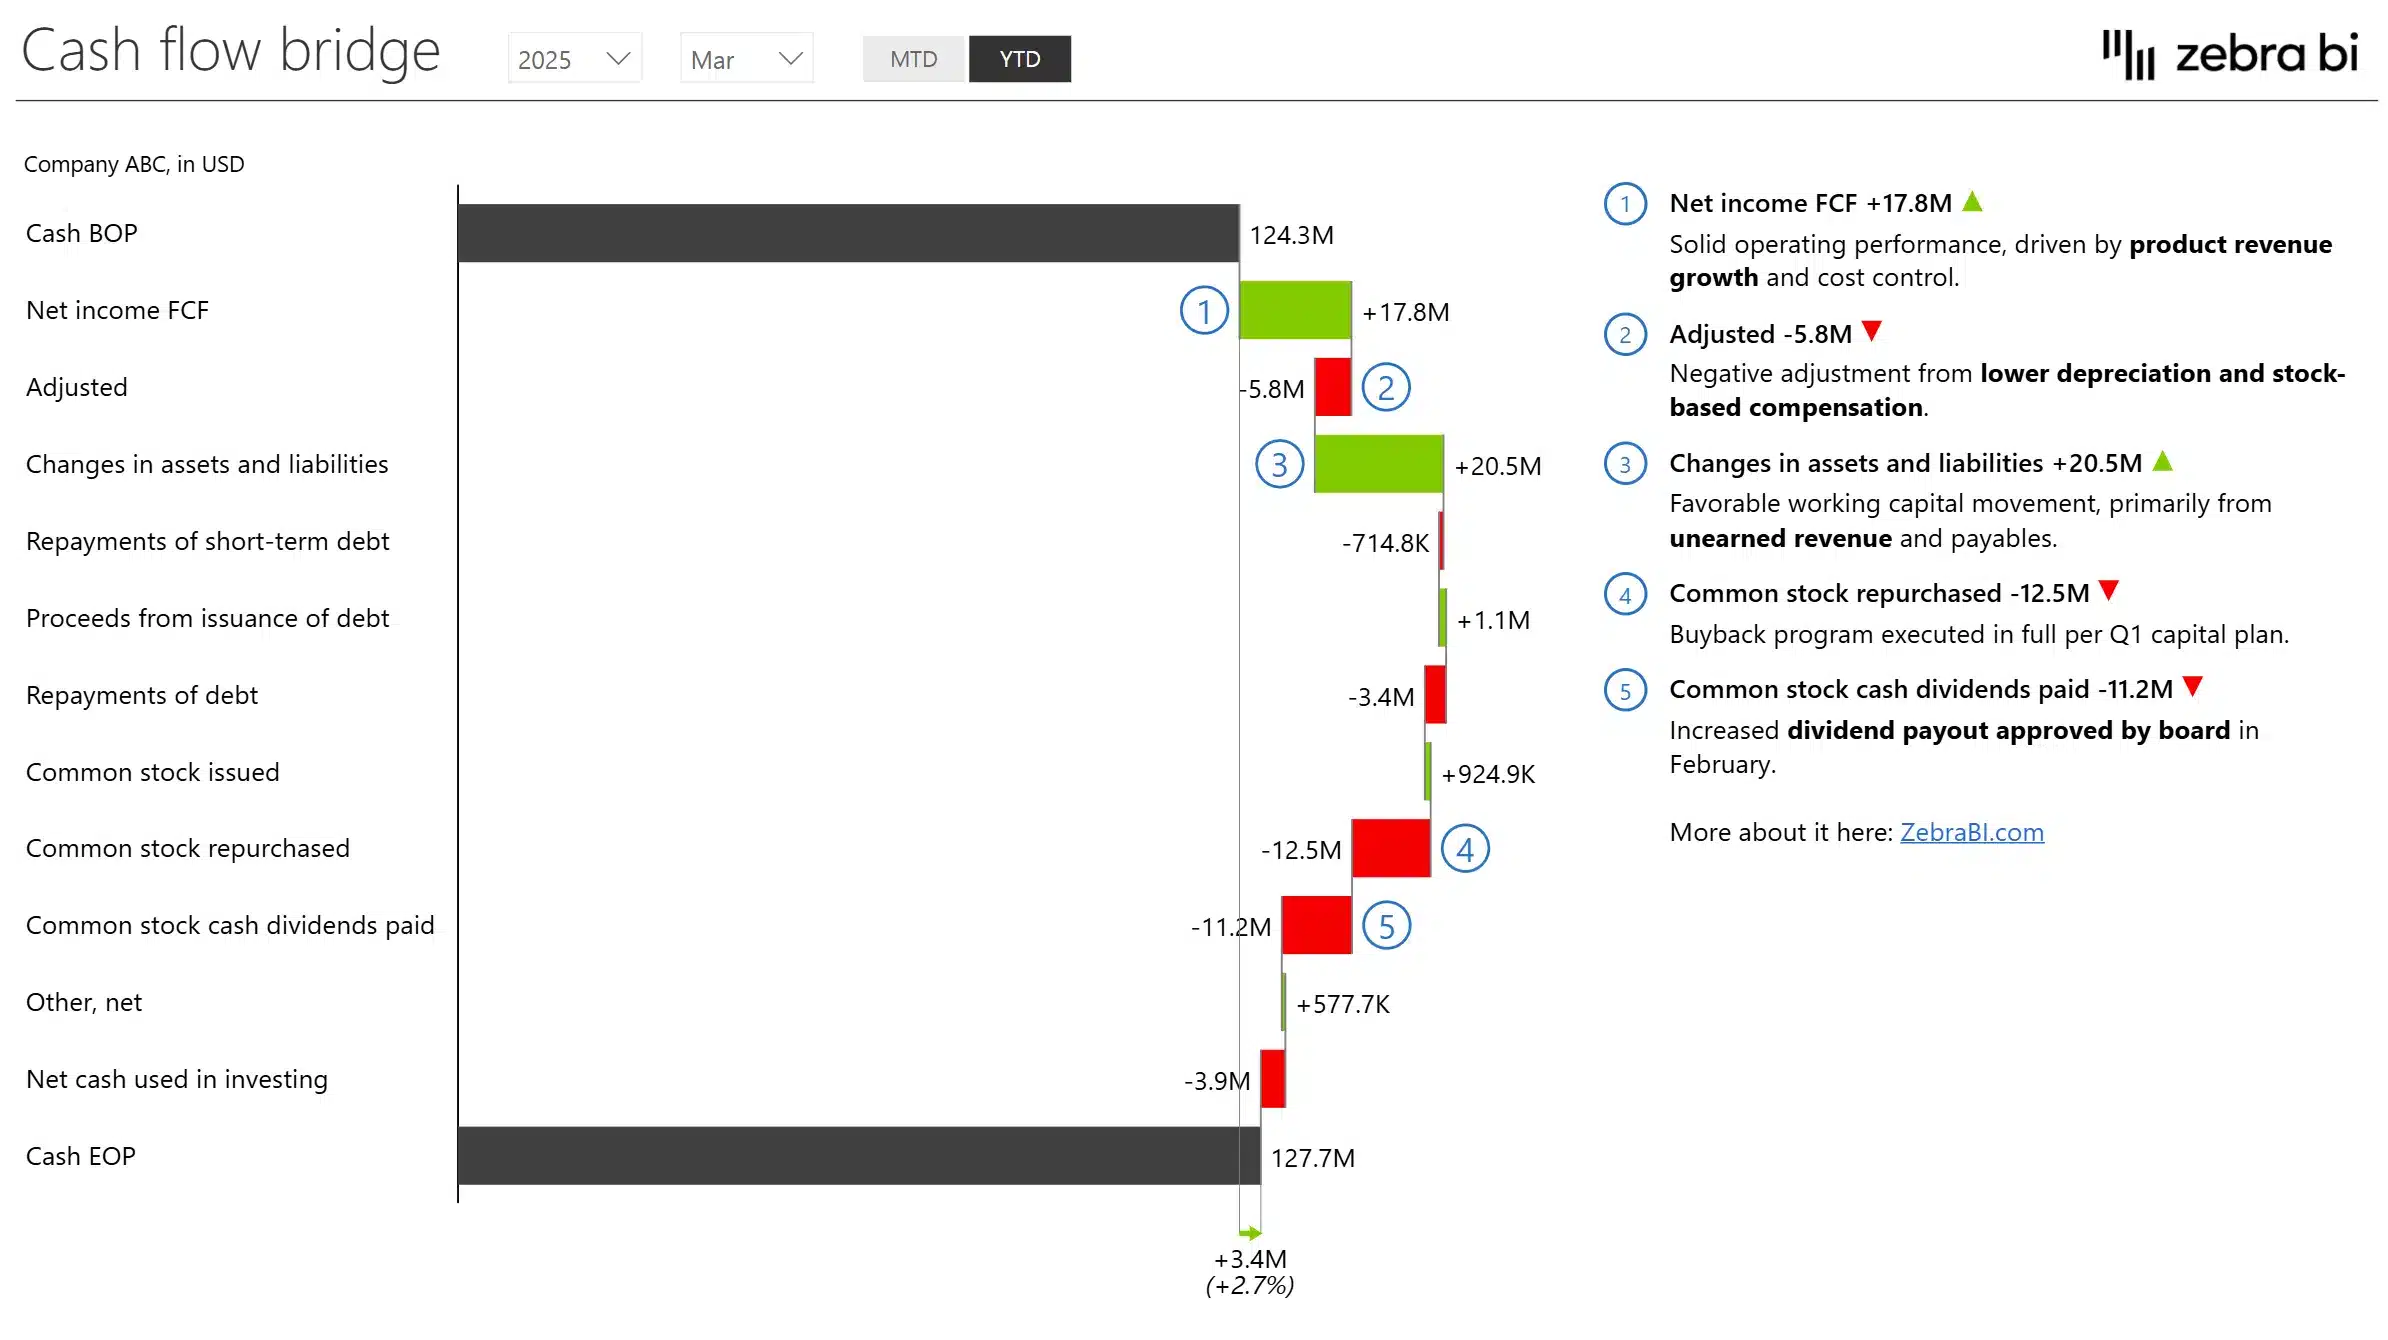
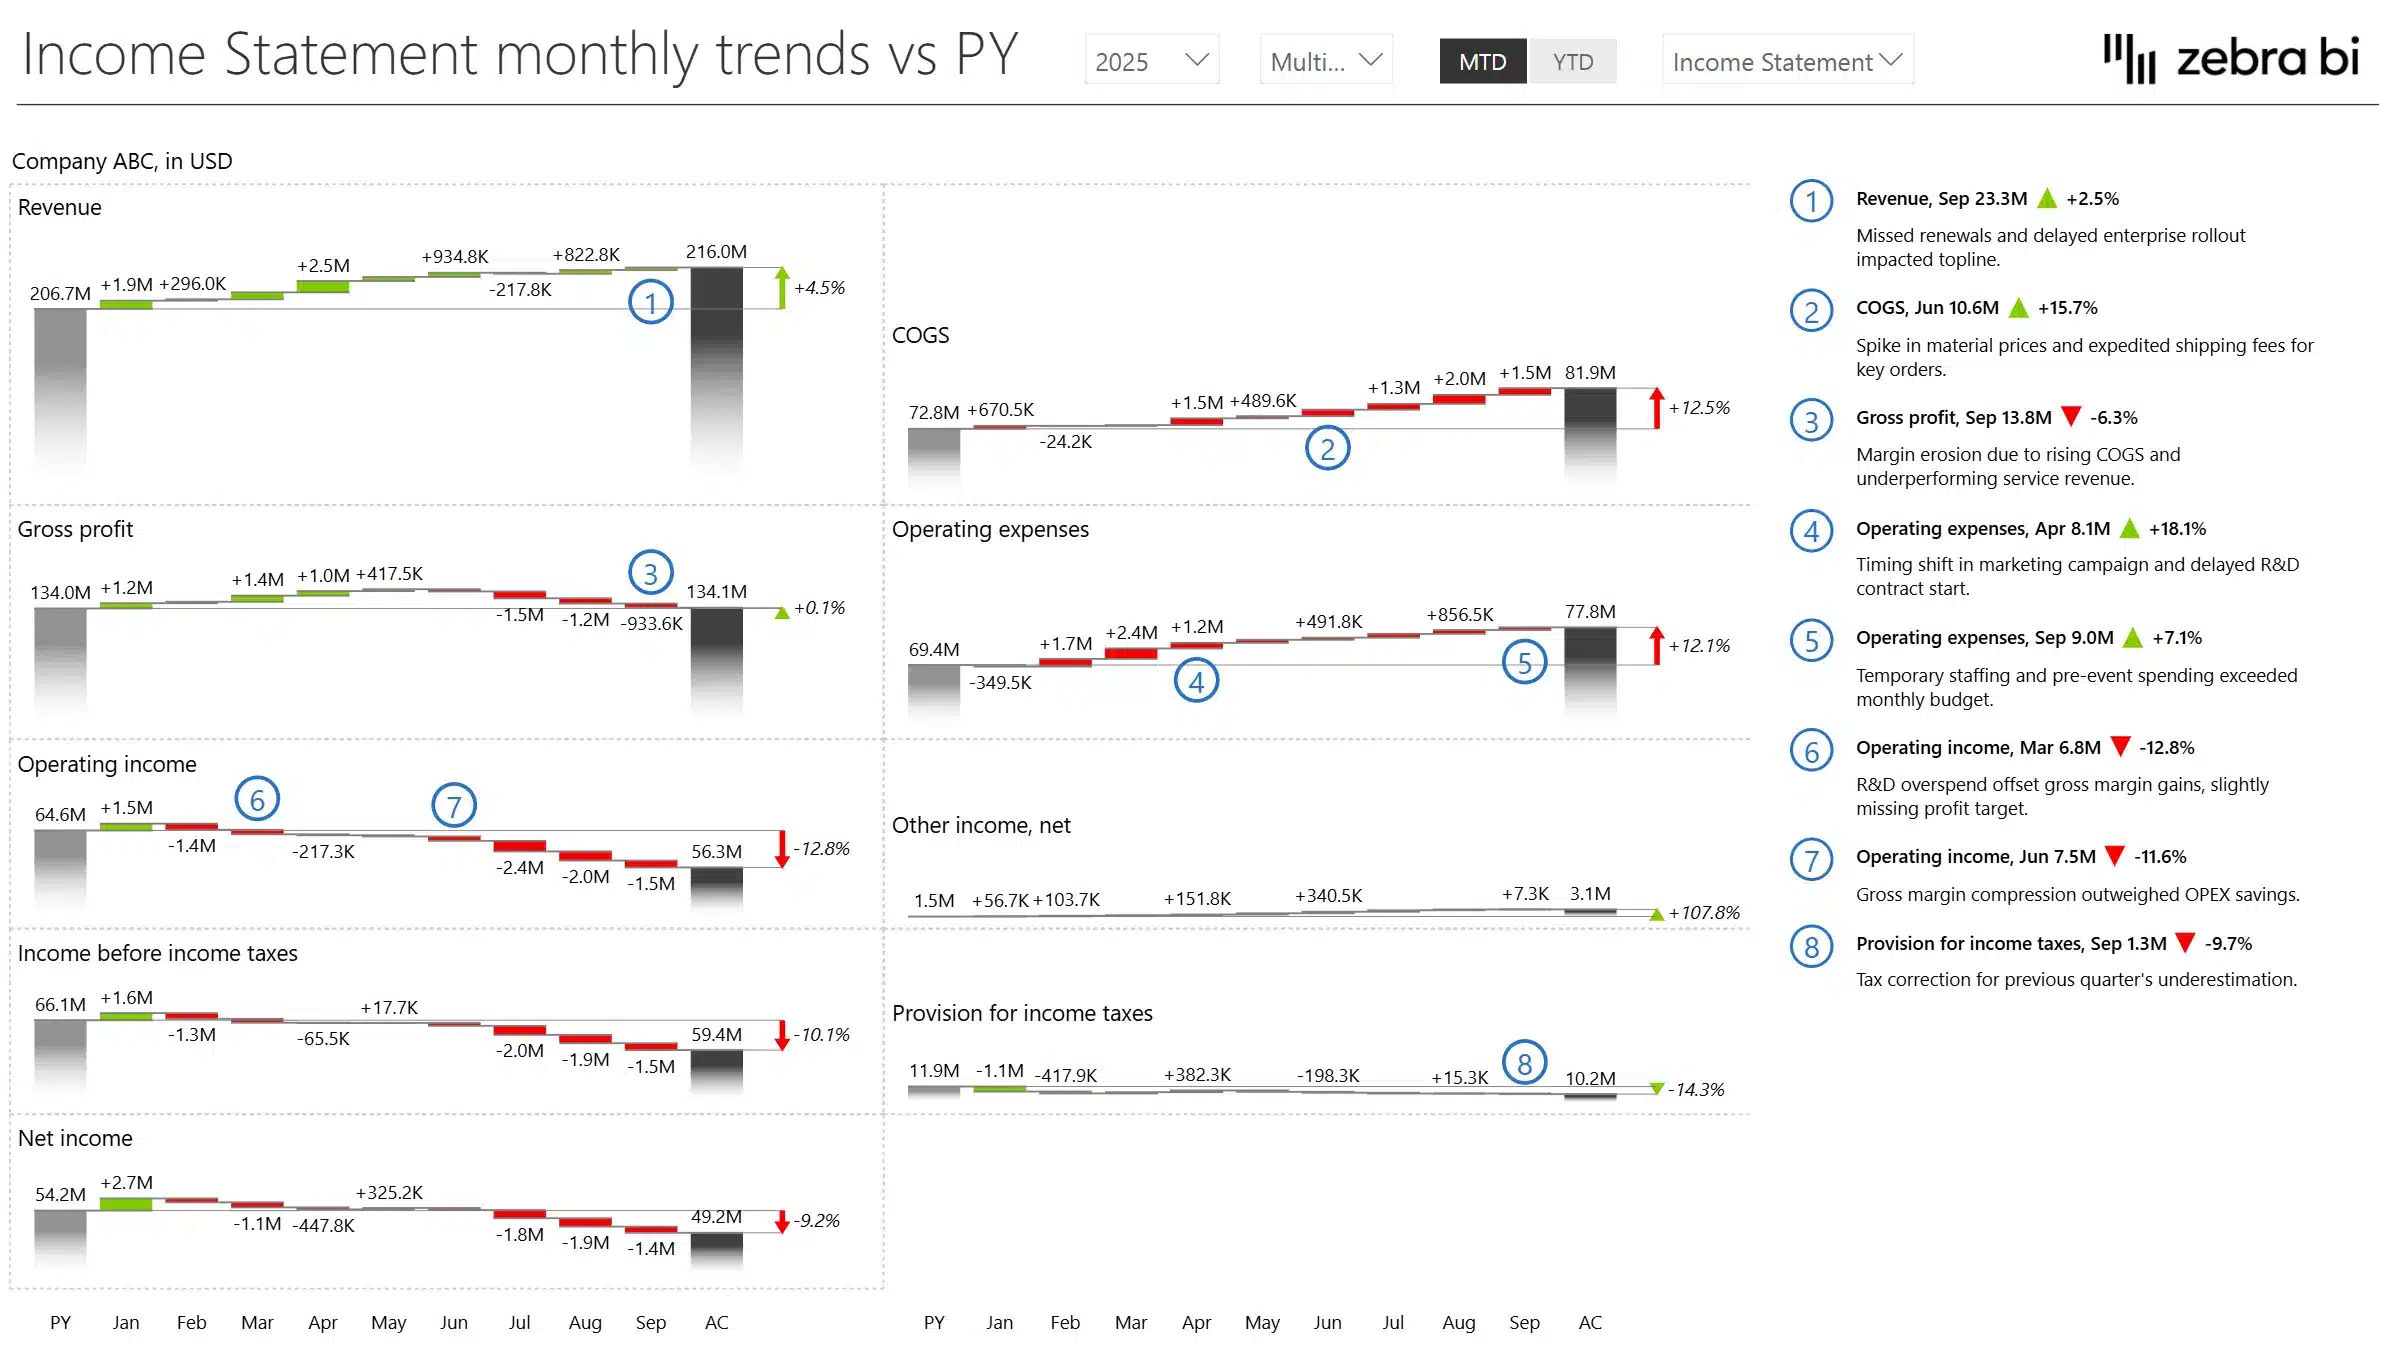
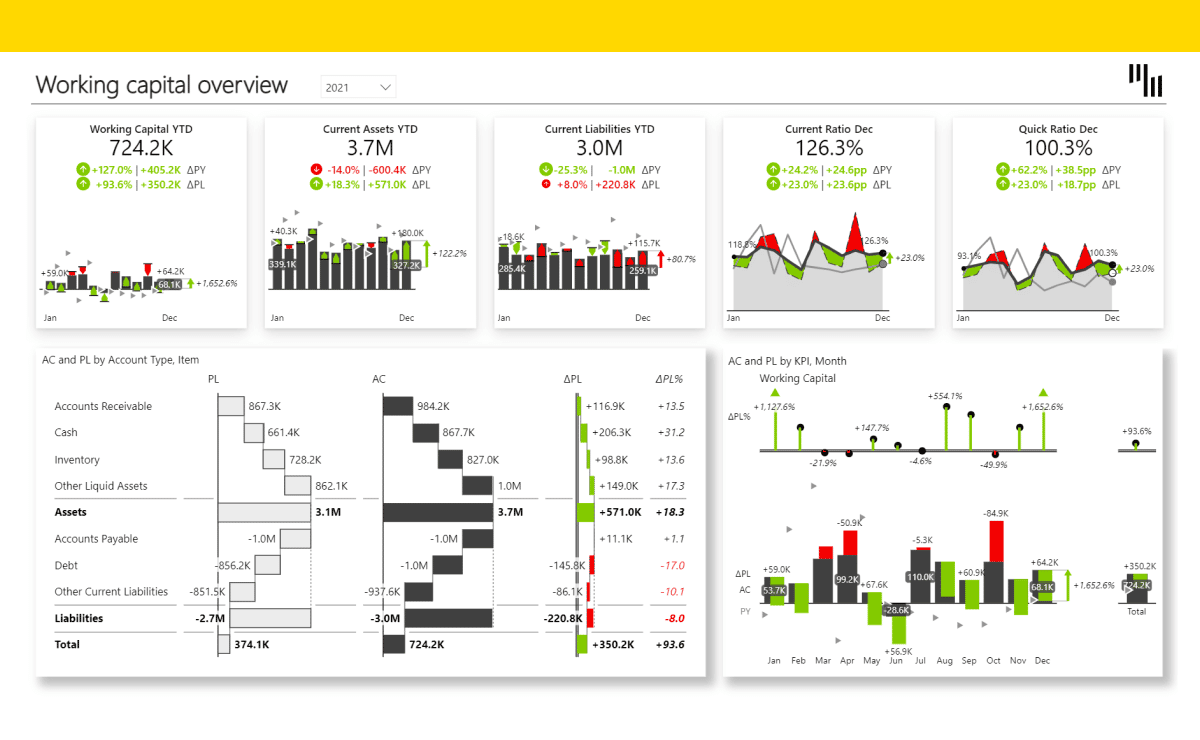
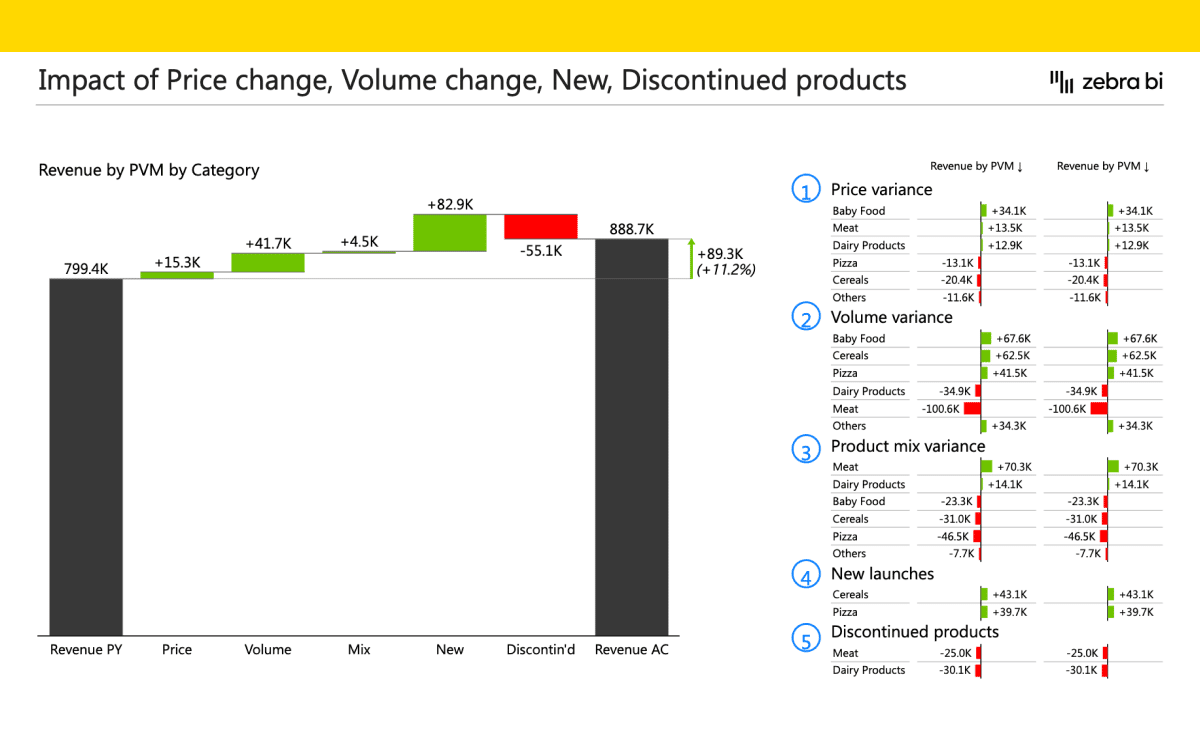
- Break down financial performance with waterfall and bridge charts
-
- Use Case: Explain changes in revenue, gross profit, operating income, or cash flow across periods or vs. plan.
-
- Benefit: Makes it easy for stakeholders to understand what’s driving increases or decreases in key metrics—no guesswork.
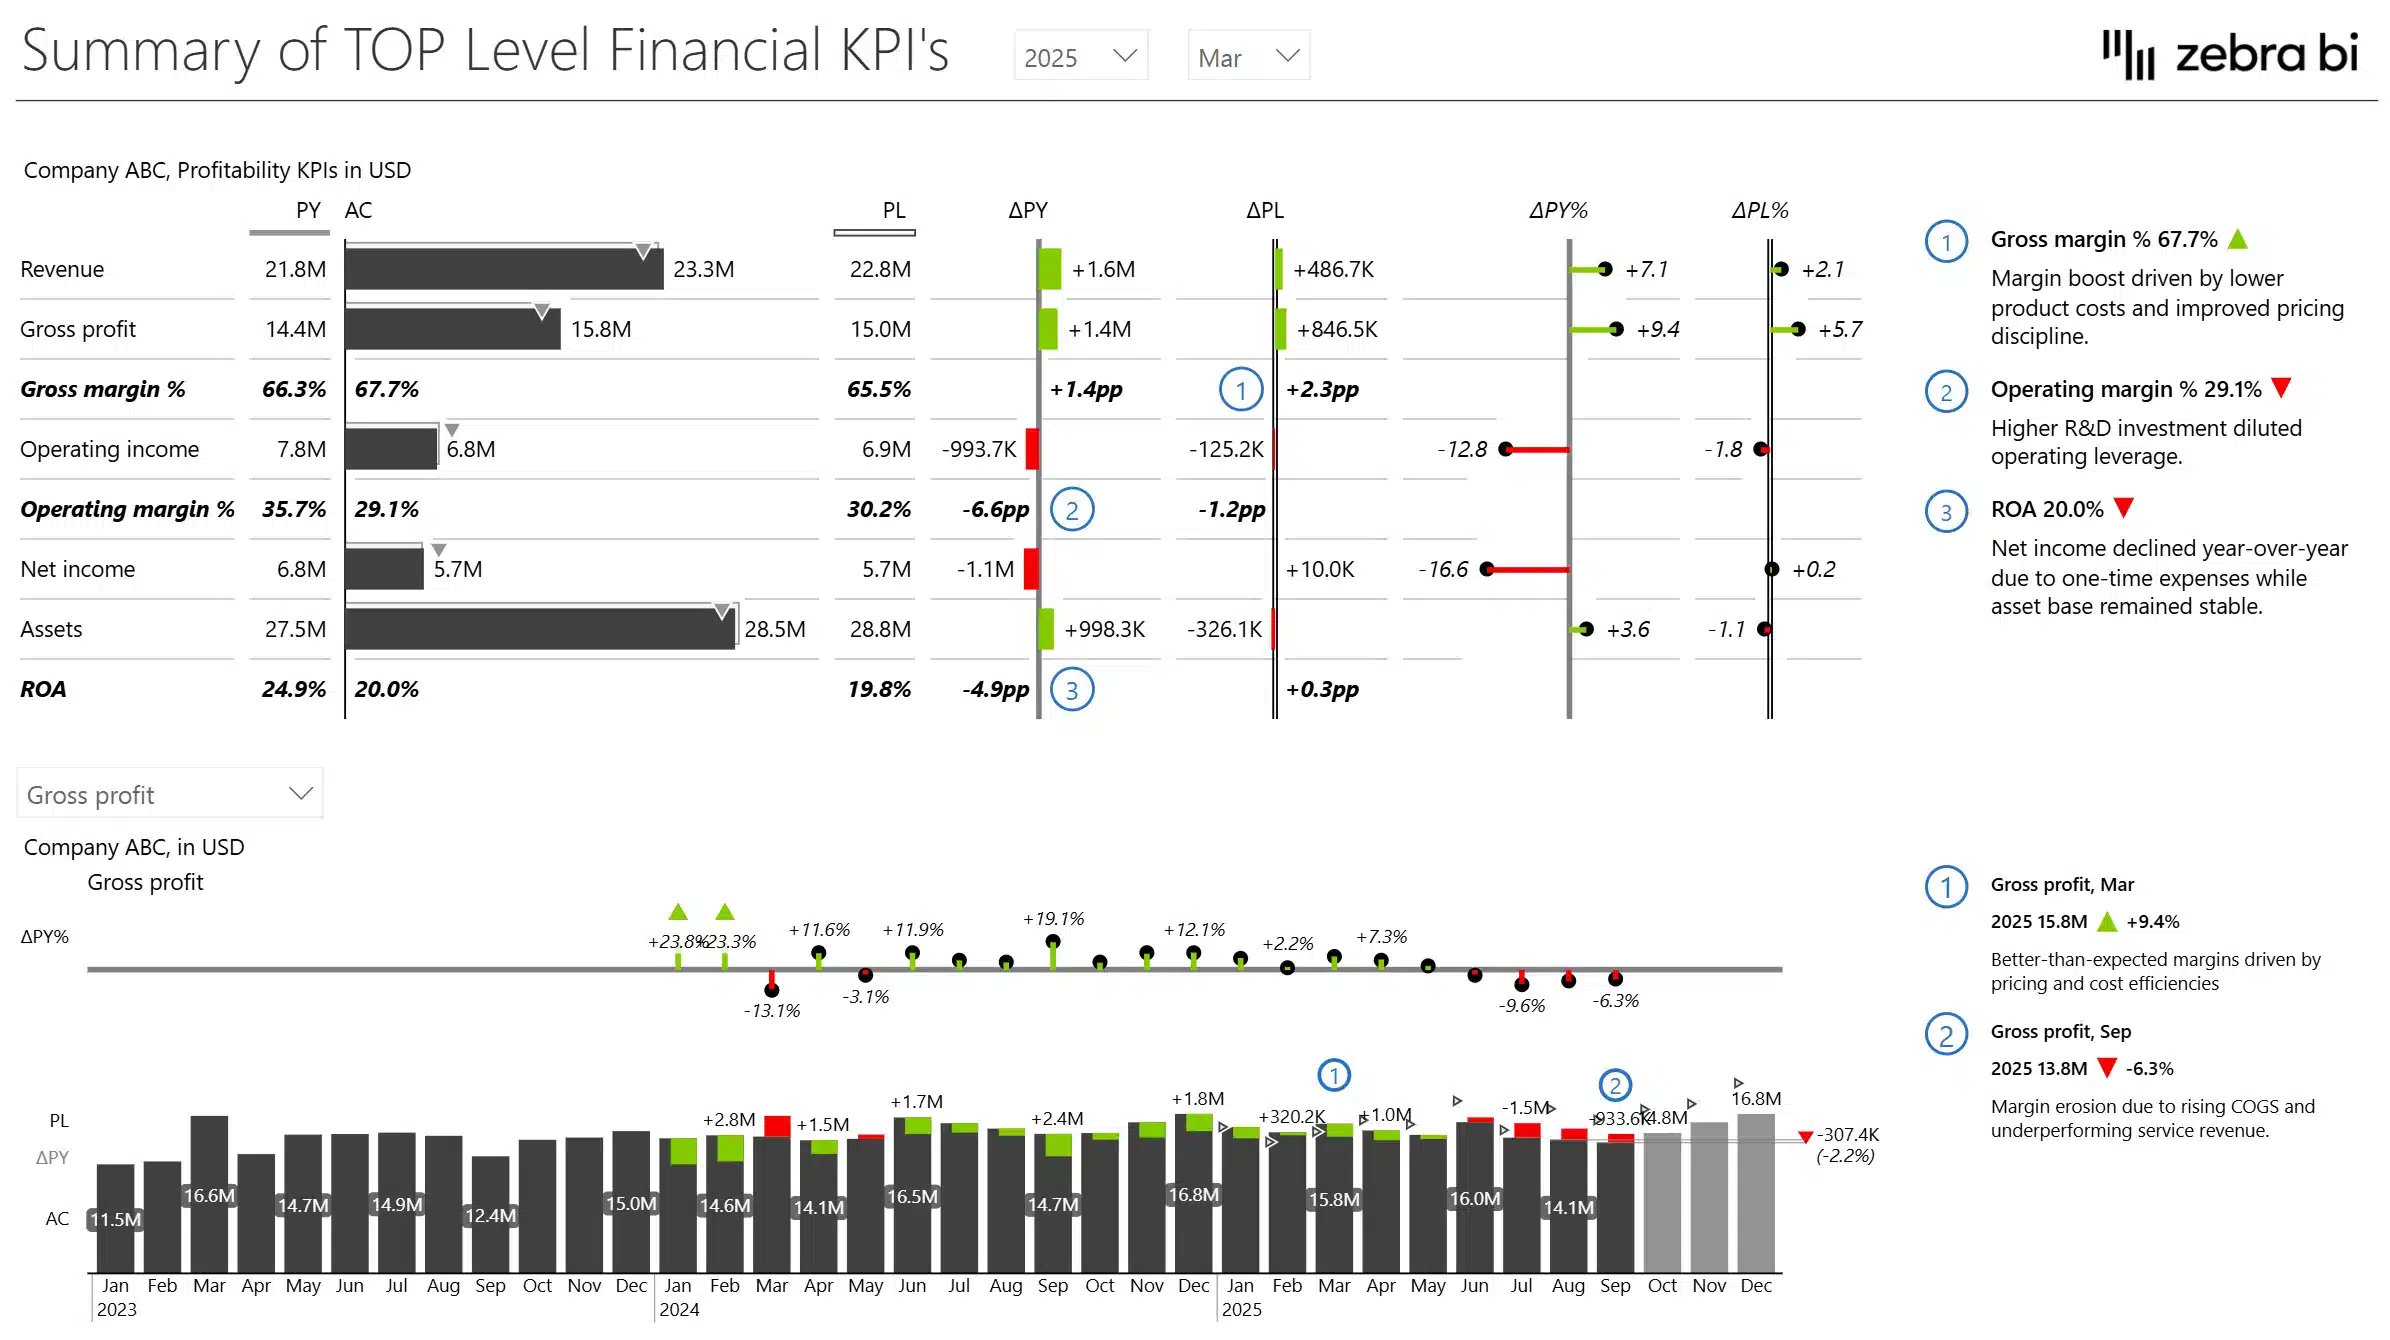
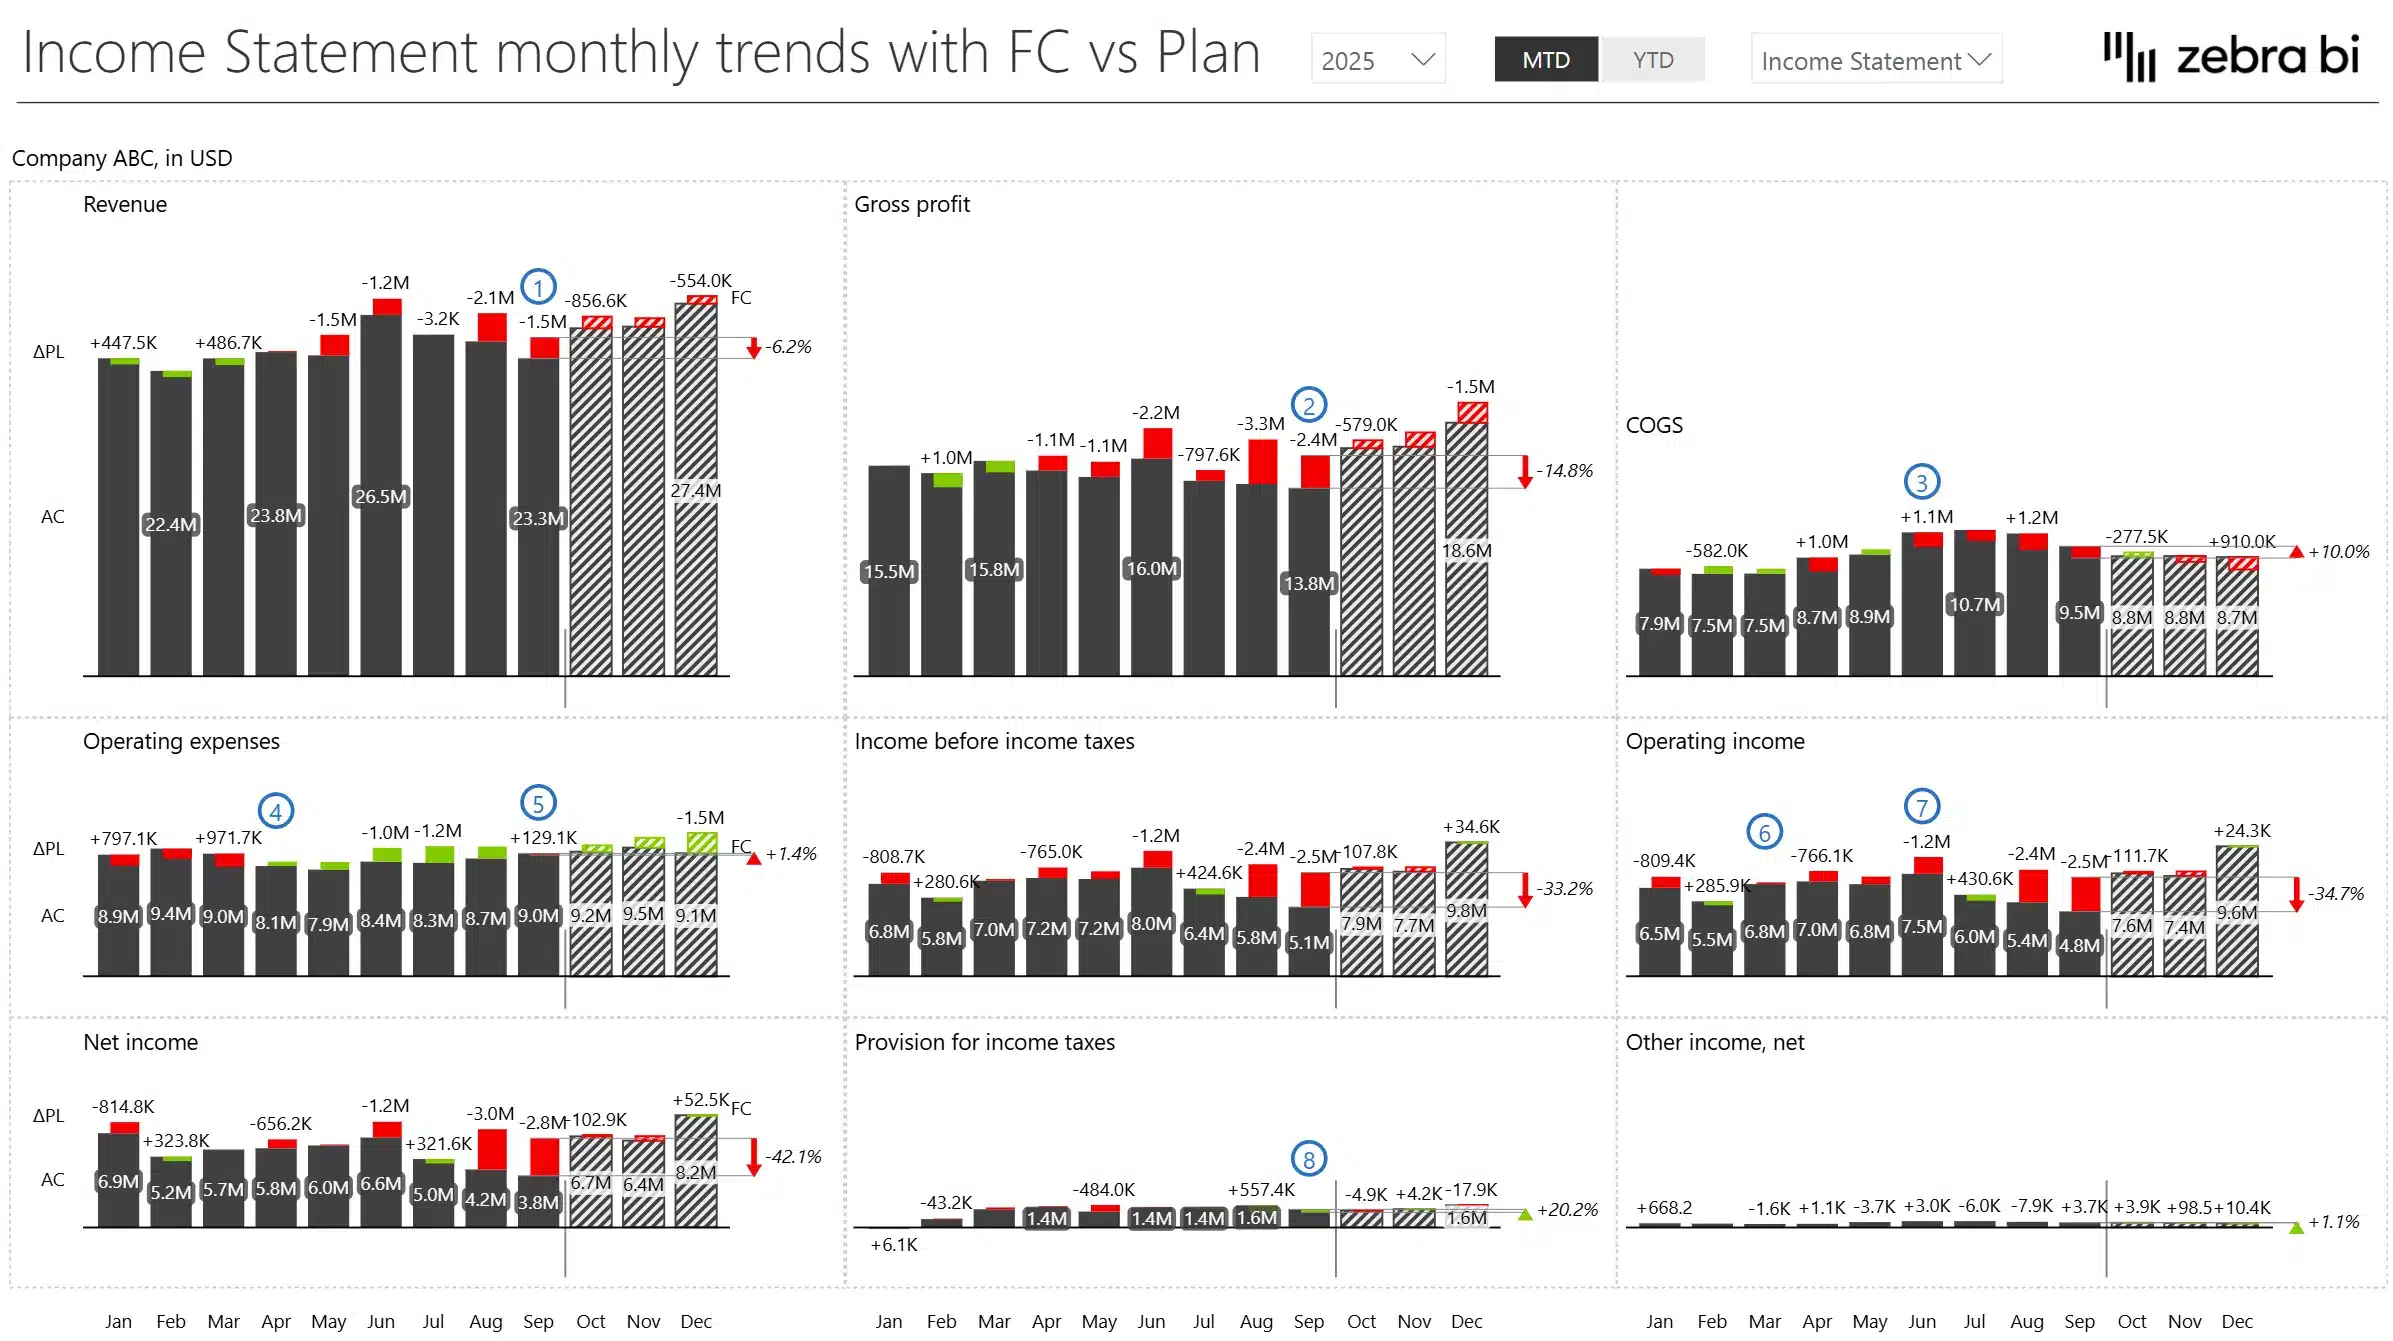
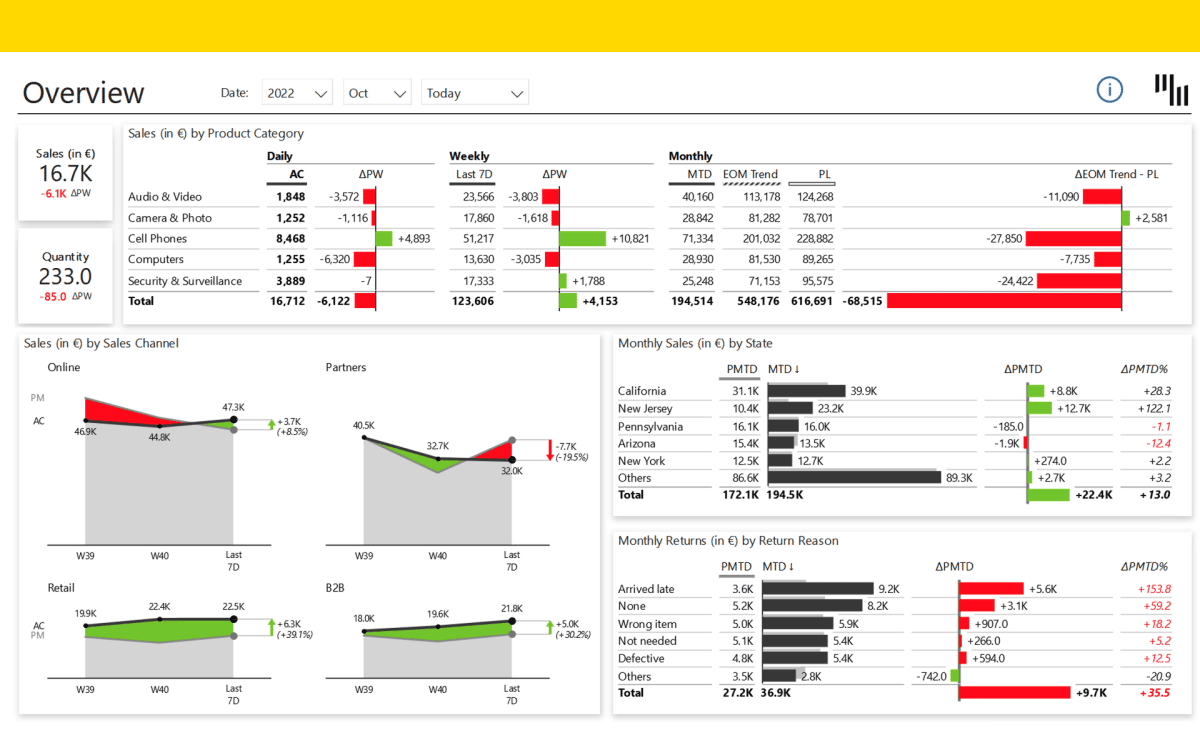
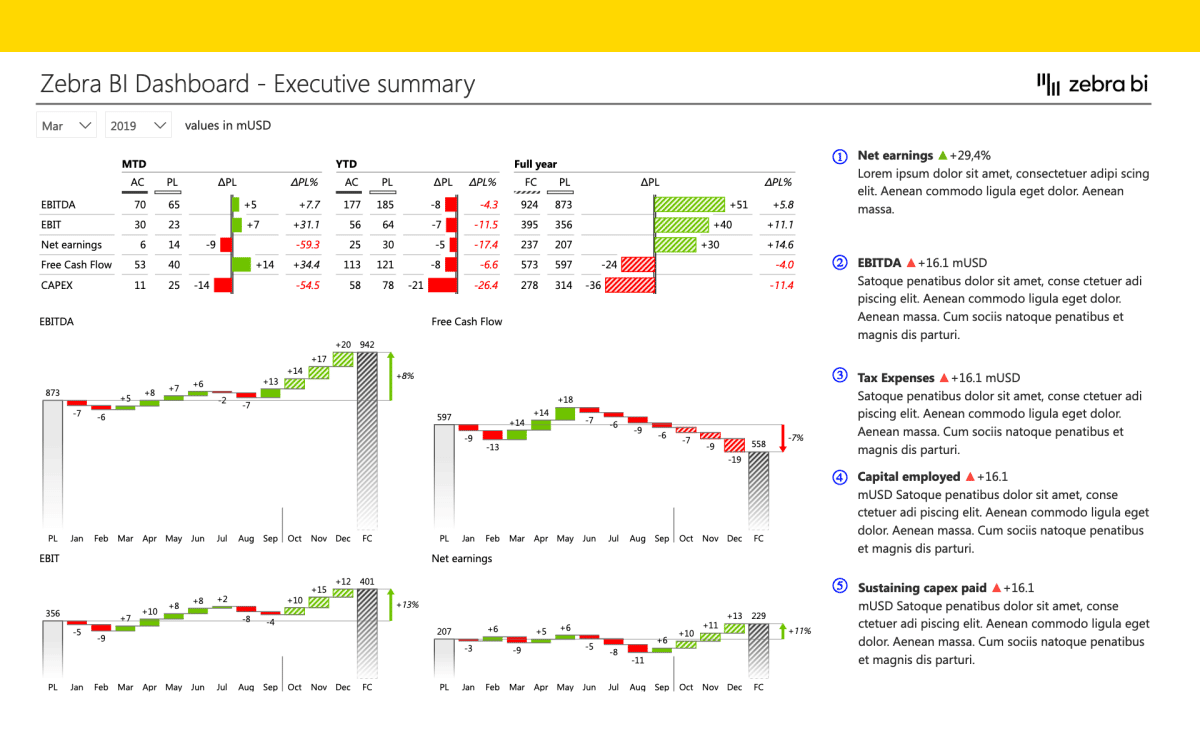
- Visualize monthly and YTD financial trends side-by-side
-
- Use Case: Display revenue, gross margin, or net income trends across months or quarters, comparing against previous year or plan.
-
- Benefit: Instantly spot seasonality, budget gaps, or deviations with built-in difference highlights and forecast overlays.
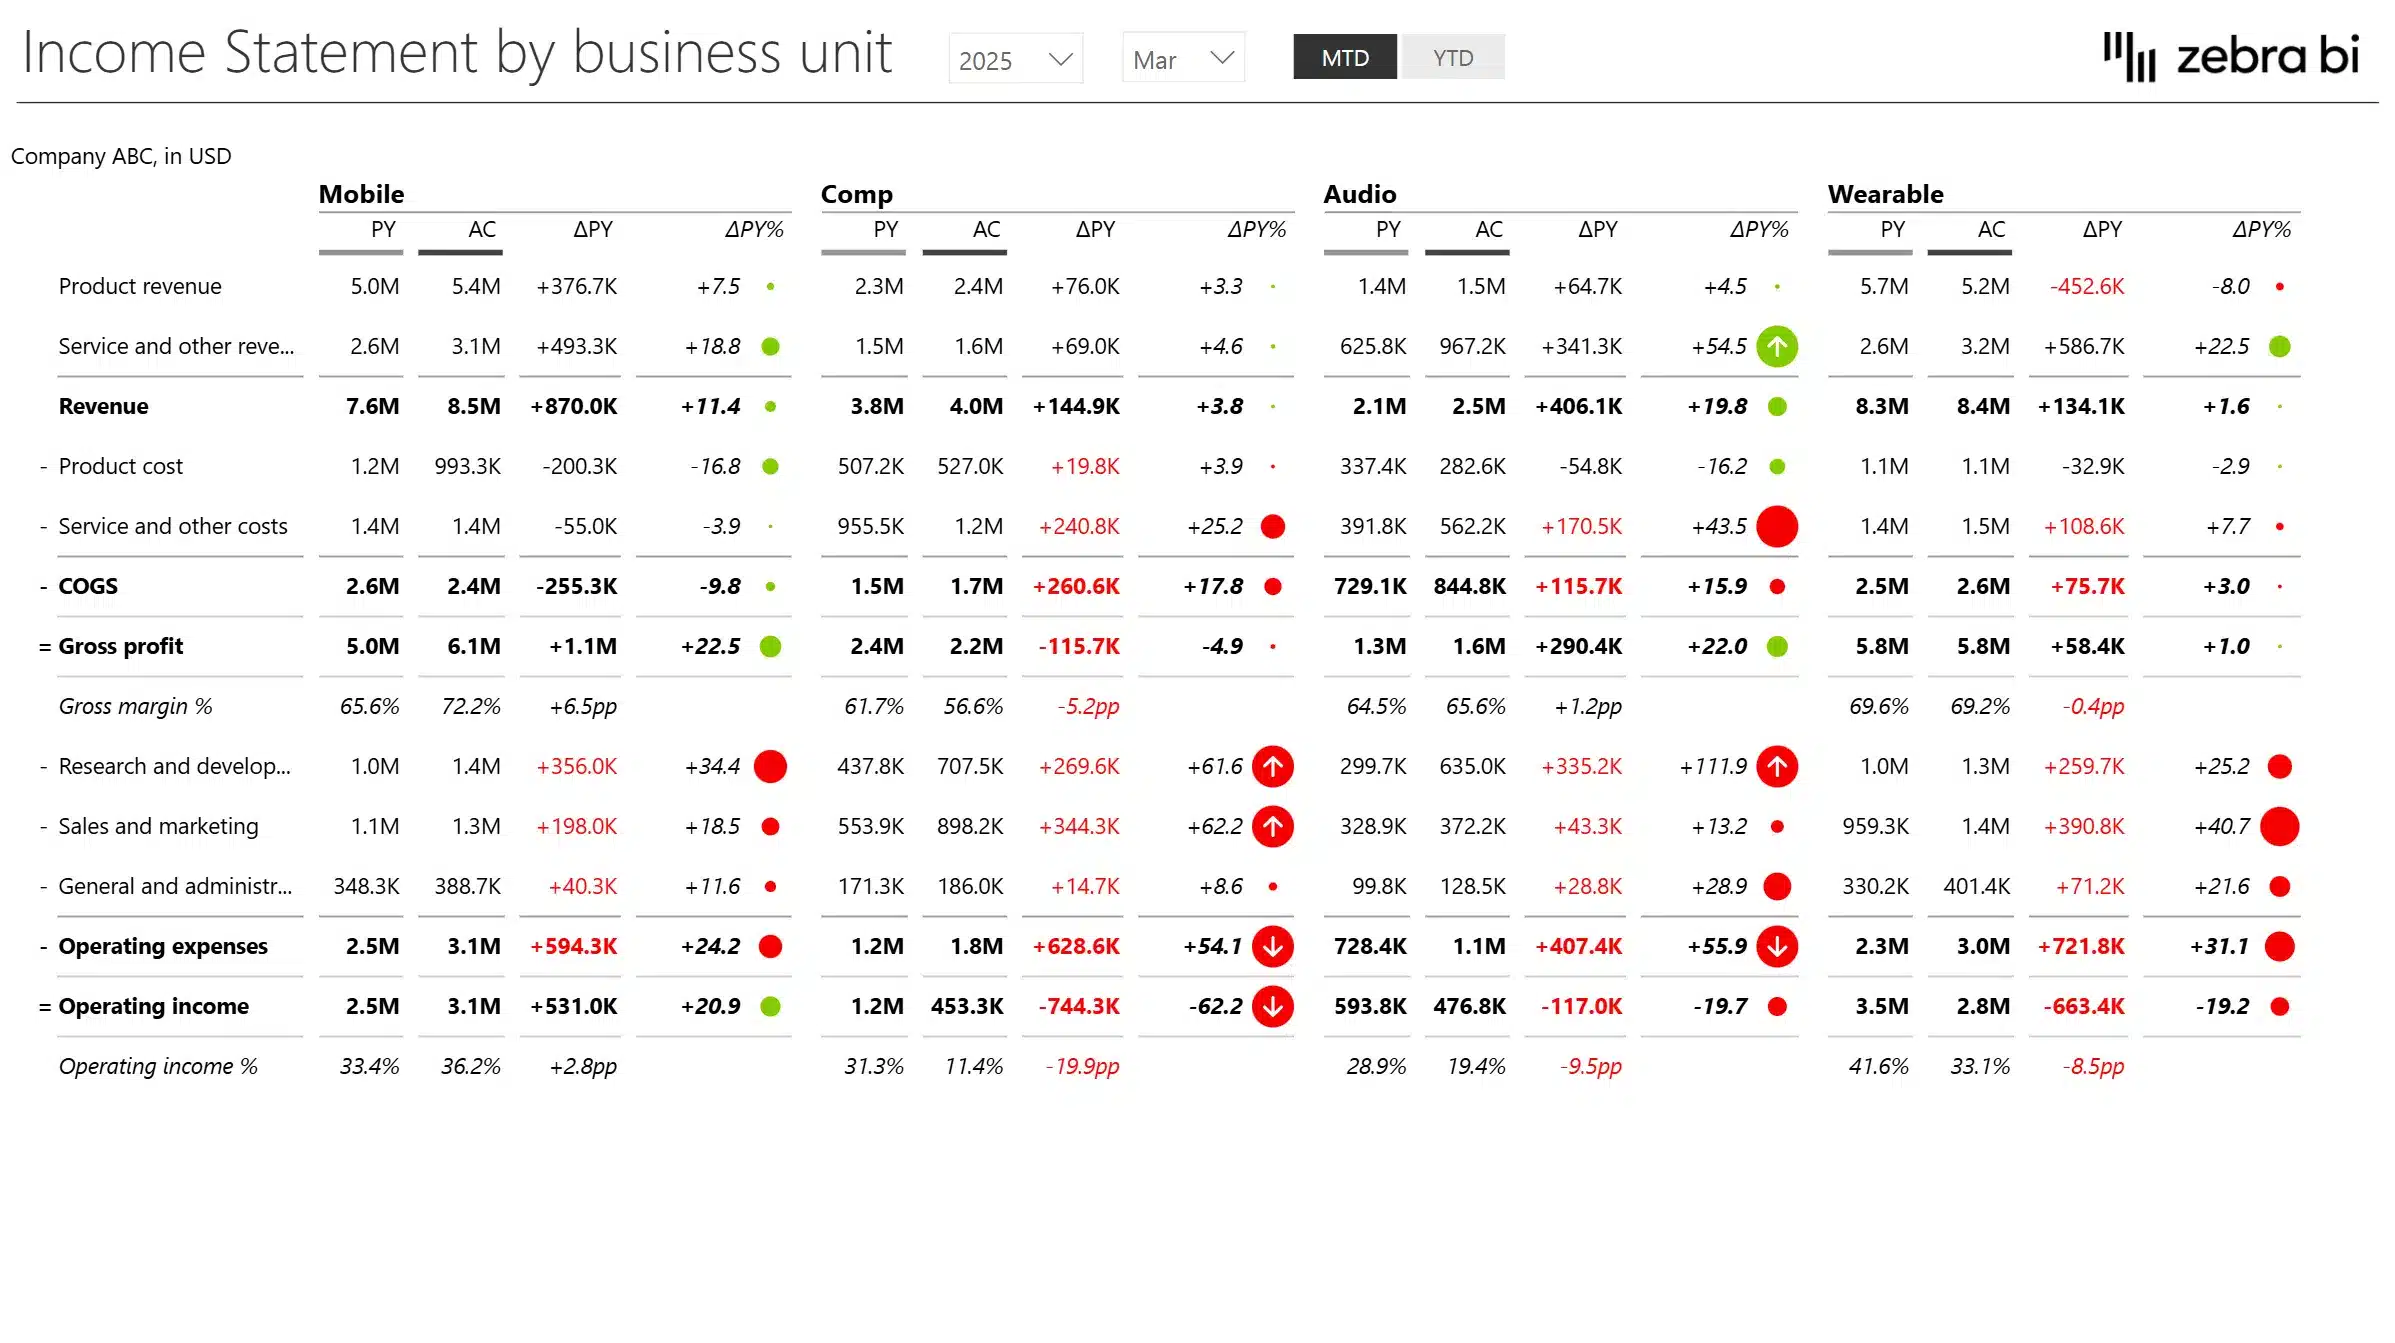
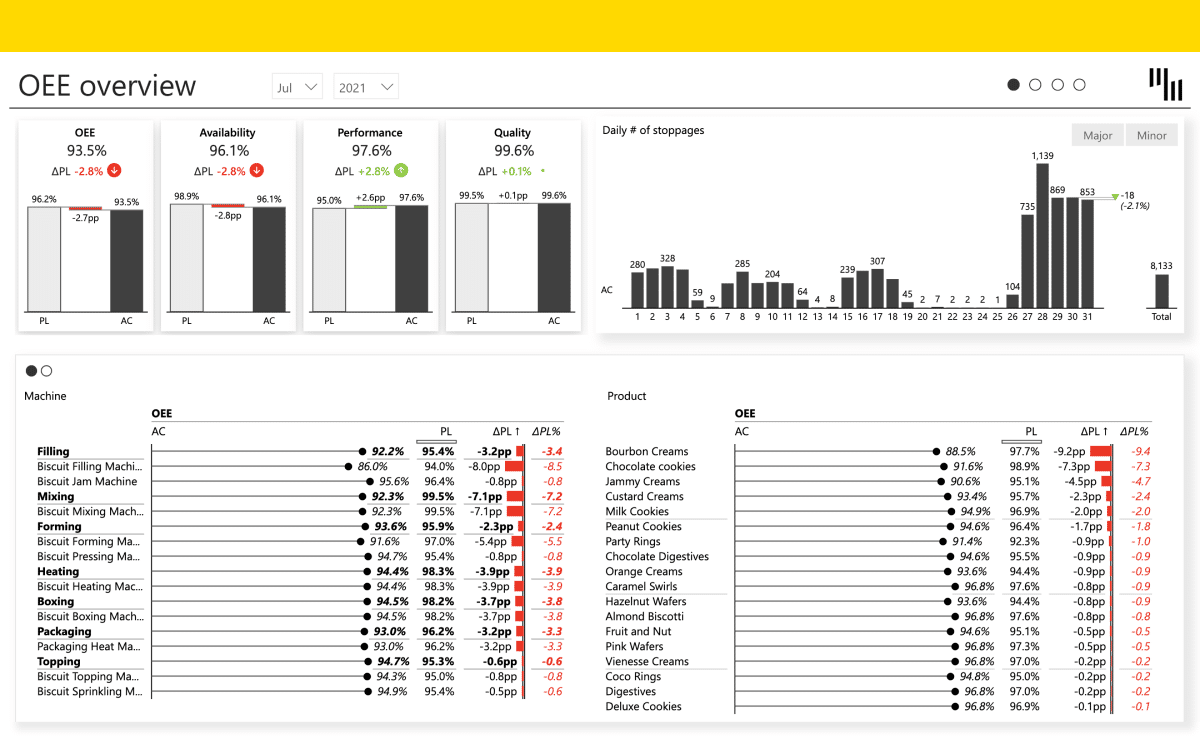
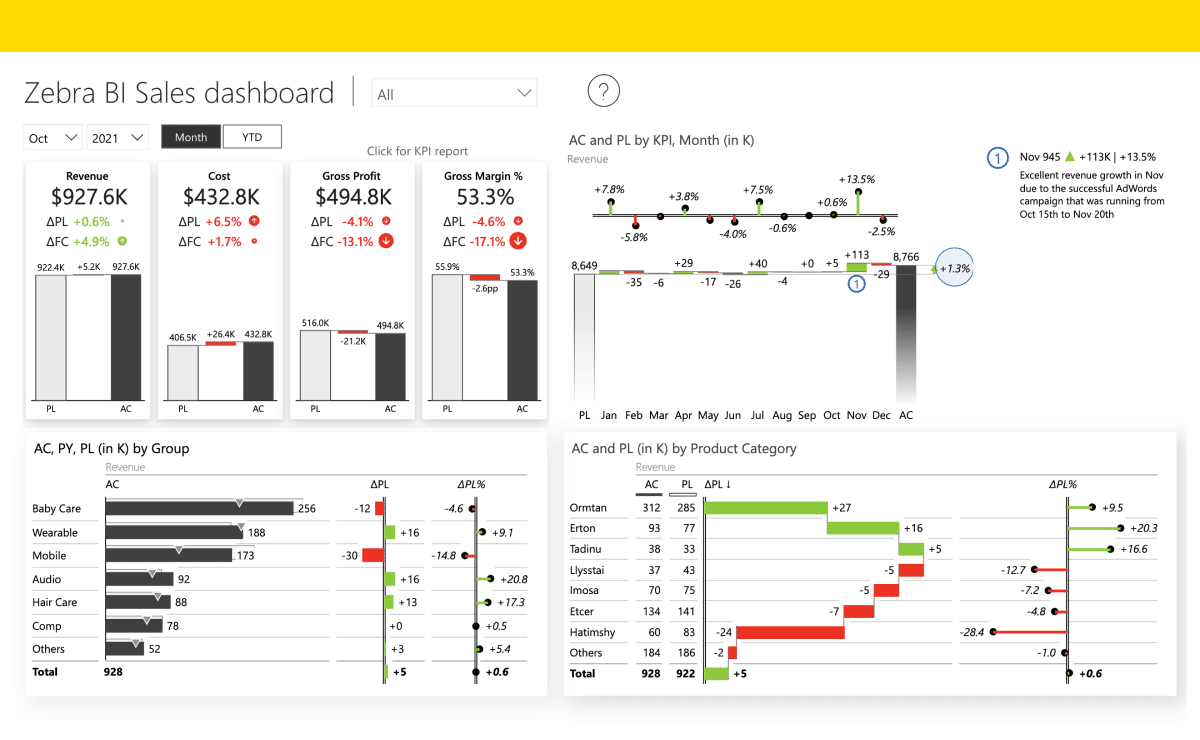
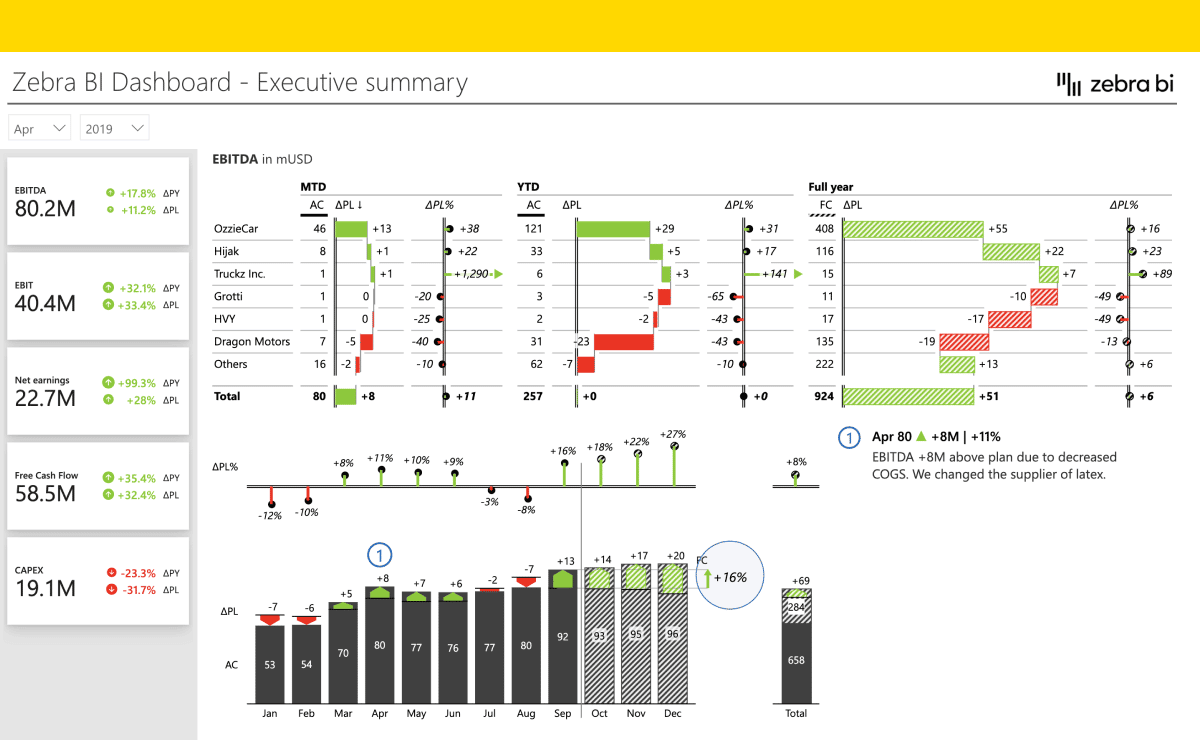
- Use small multiples to compare financial KPIs across business units or product lines
-
- Use Case: Compare operating income, gross profit, or R&D spend across business segments (e.g., Mobile vs. Audio).
-
- Benefit: Enables standardized, scalable storytelling that highlights which units outperform or underdeliver—without needing multiple pages.
Zebra BI Tables:
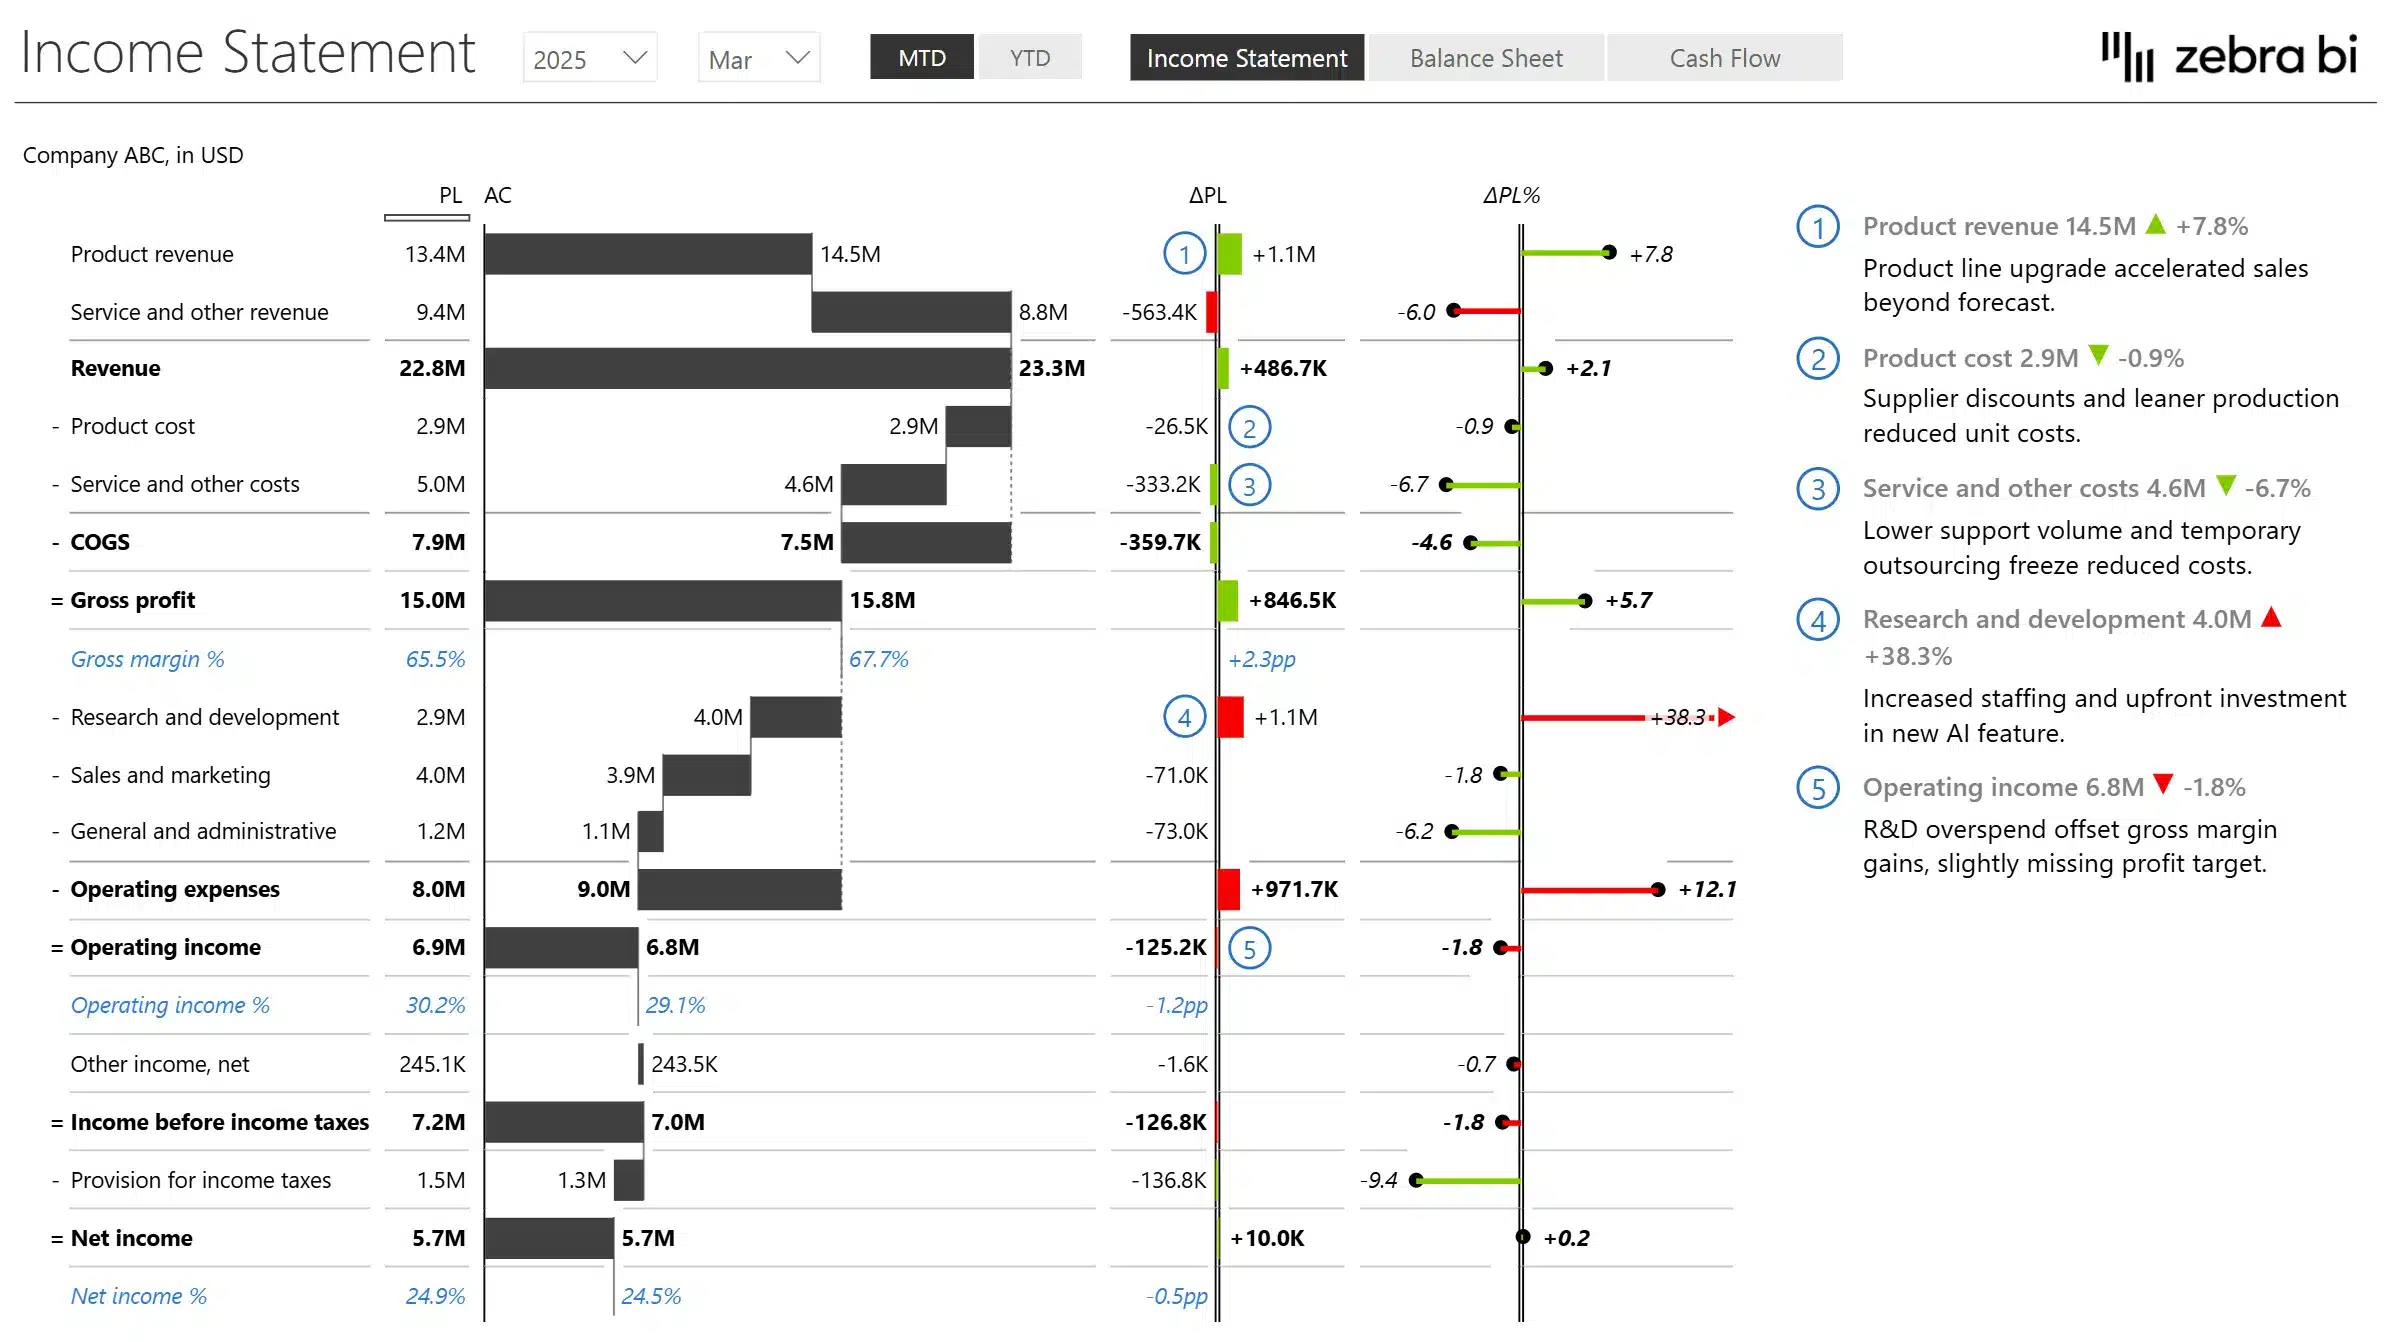
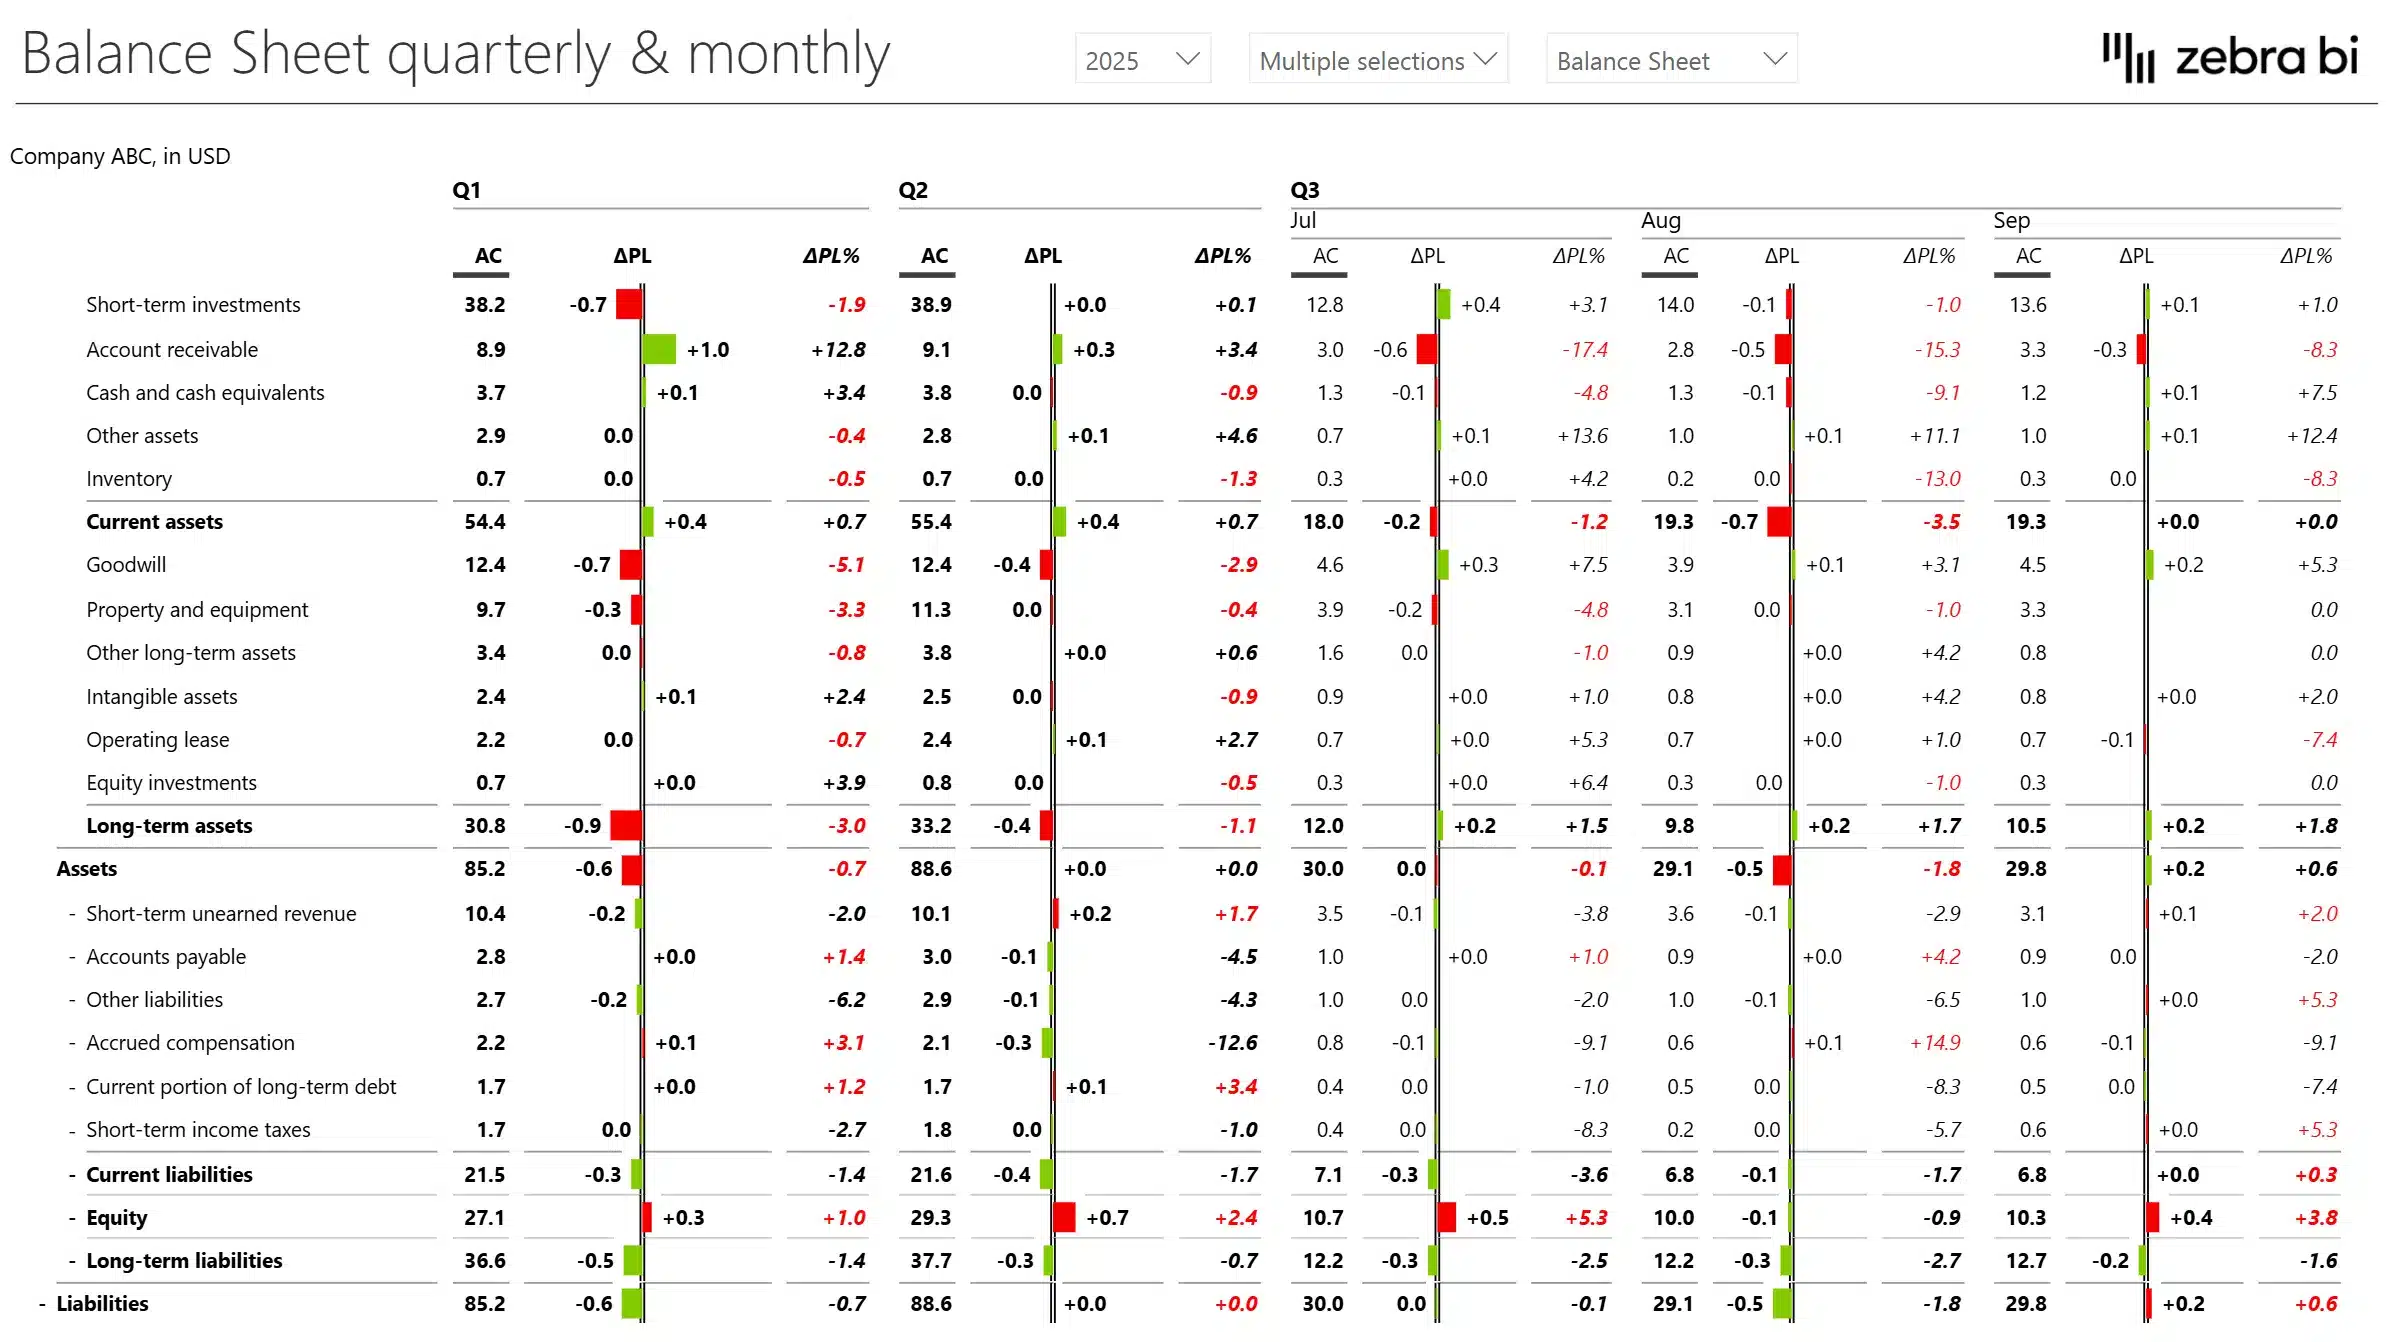
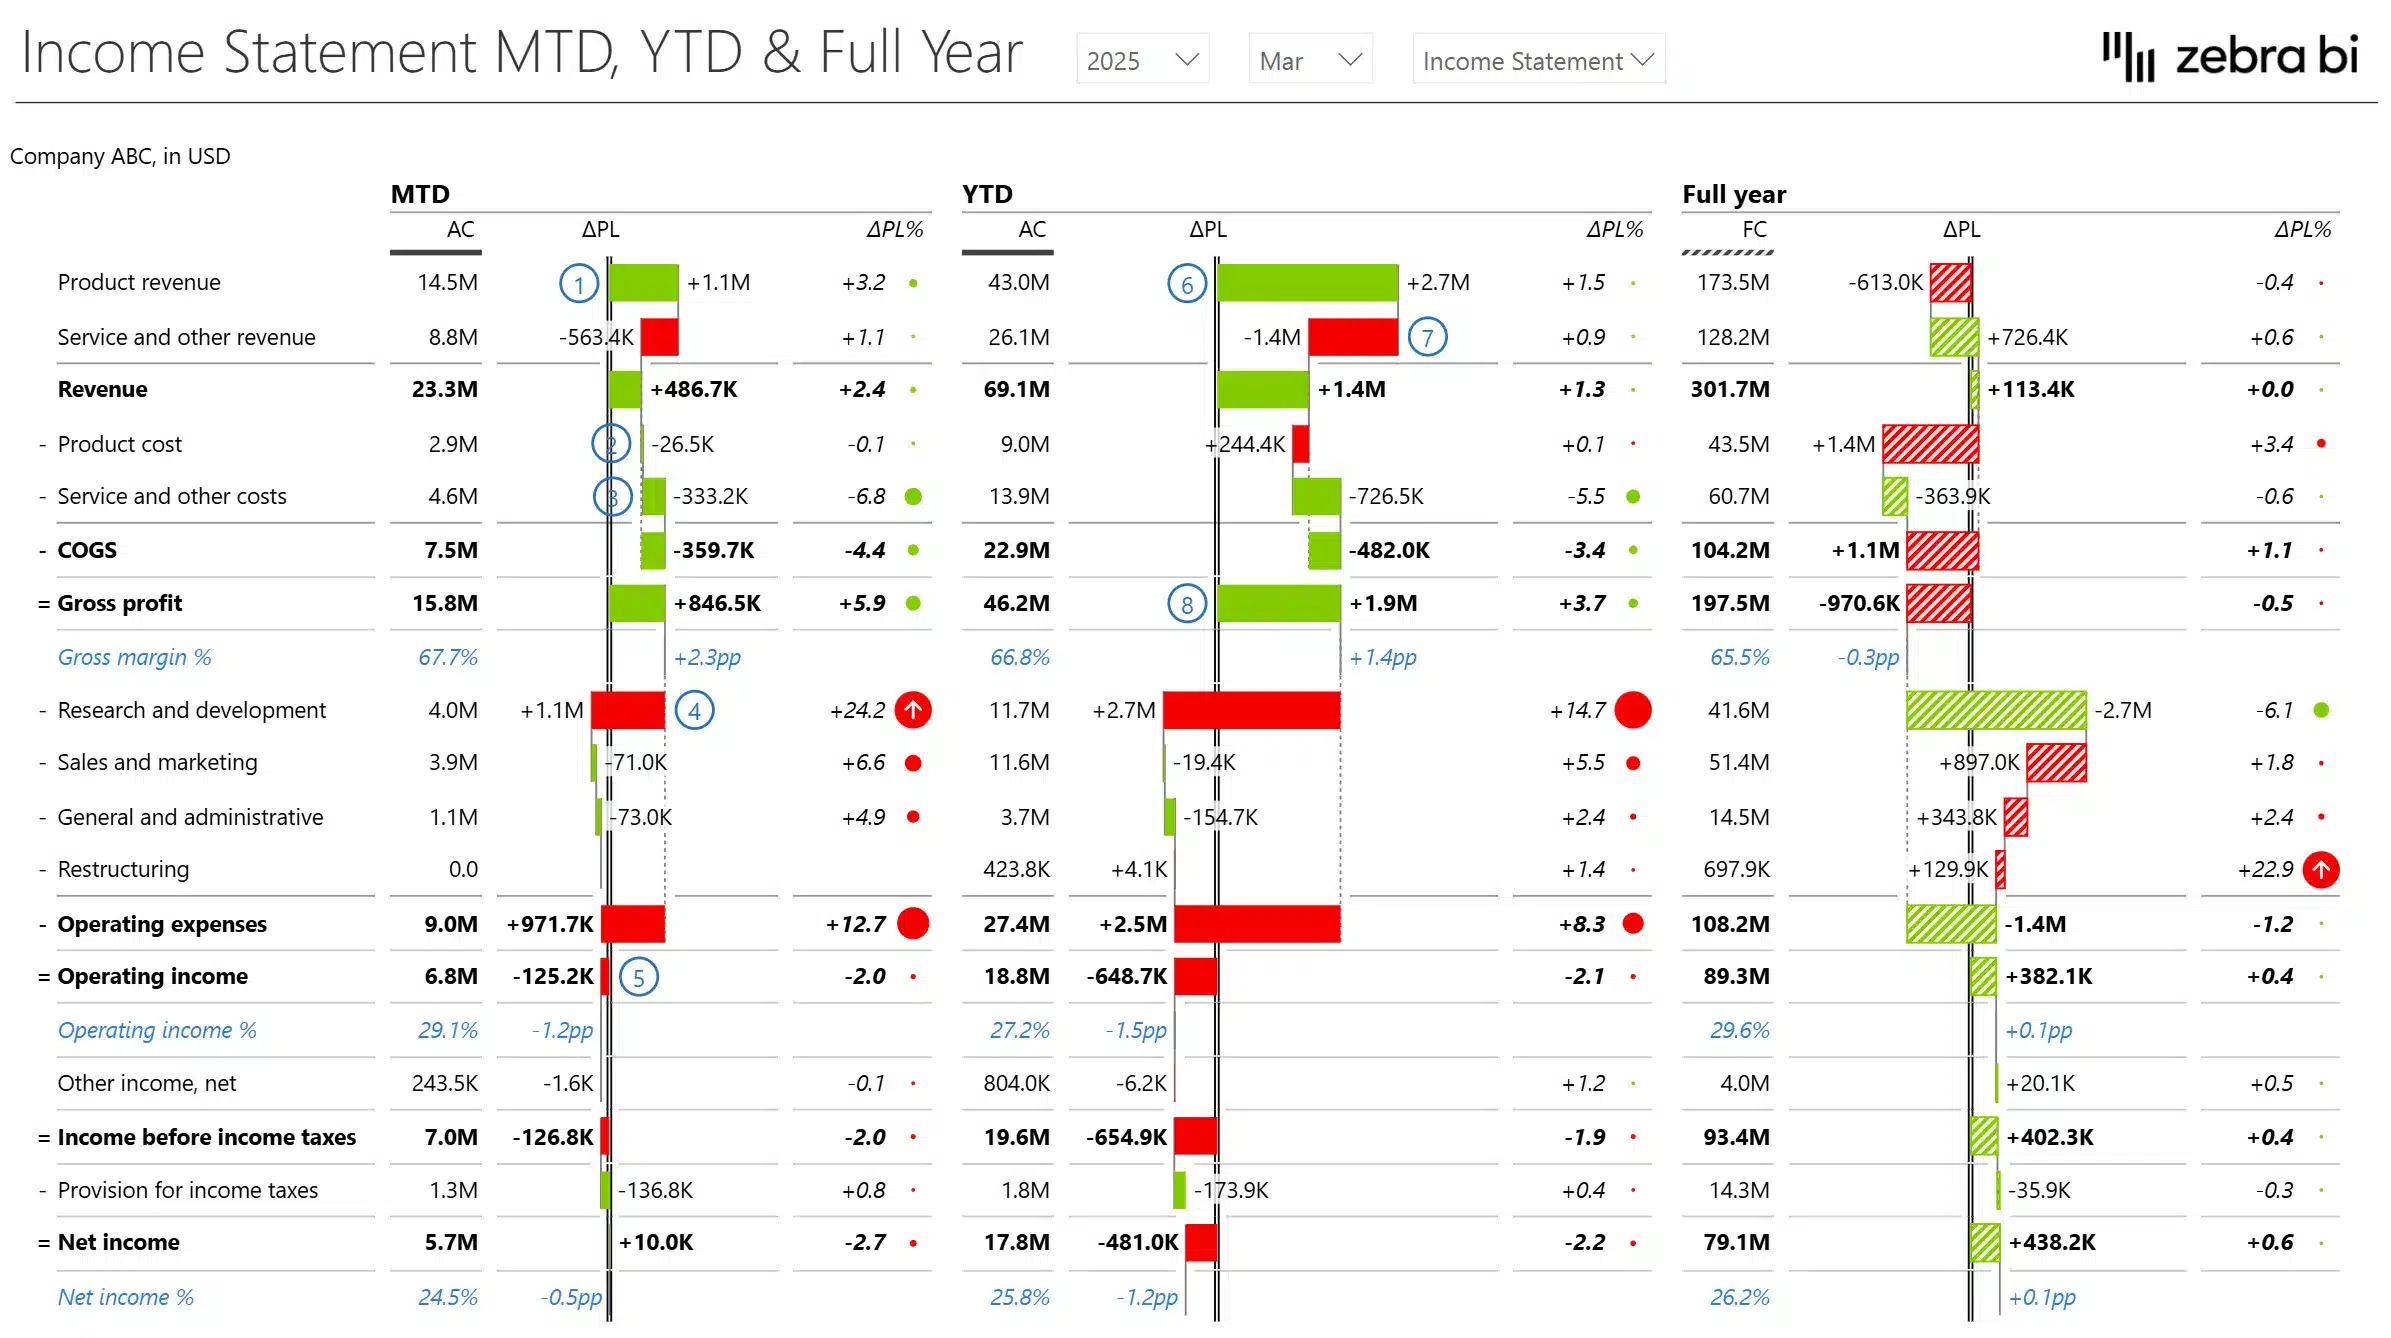
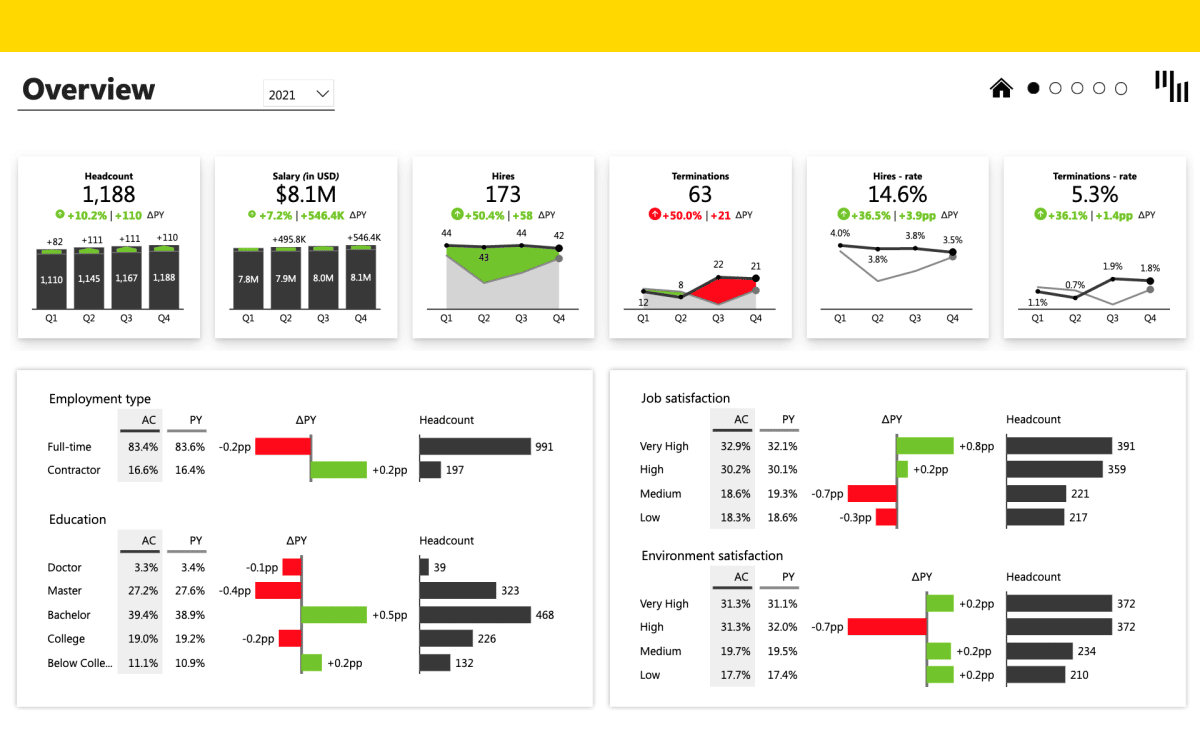
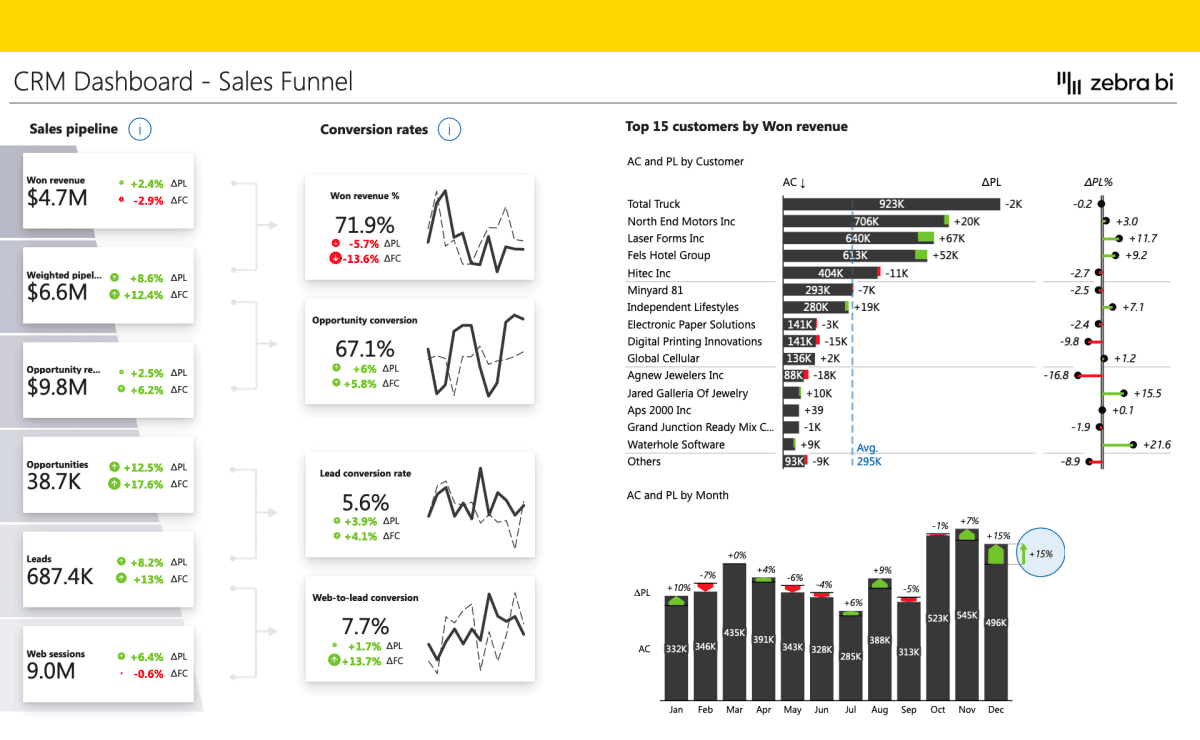
- Create dynamic income statements with built-in variance analysis
-
- Use Case: Build monthly, YTD, and full-year P&L views that compare actuals vs. plan and prior year.
-
- Benefit: Combine financial structure with automatic variance bars and % change—making deviations obvious and digestible.
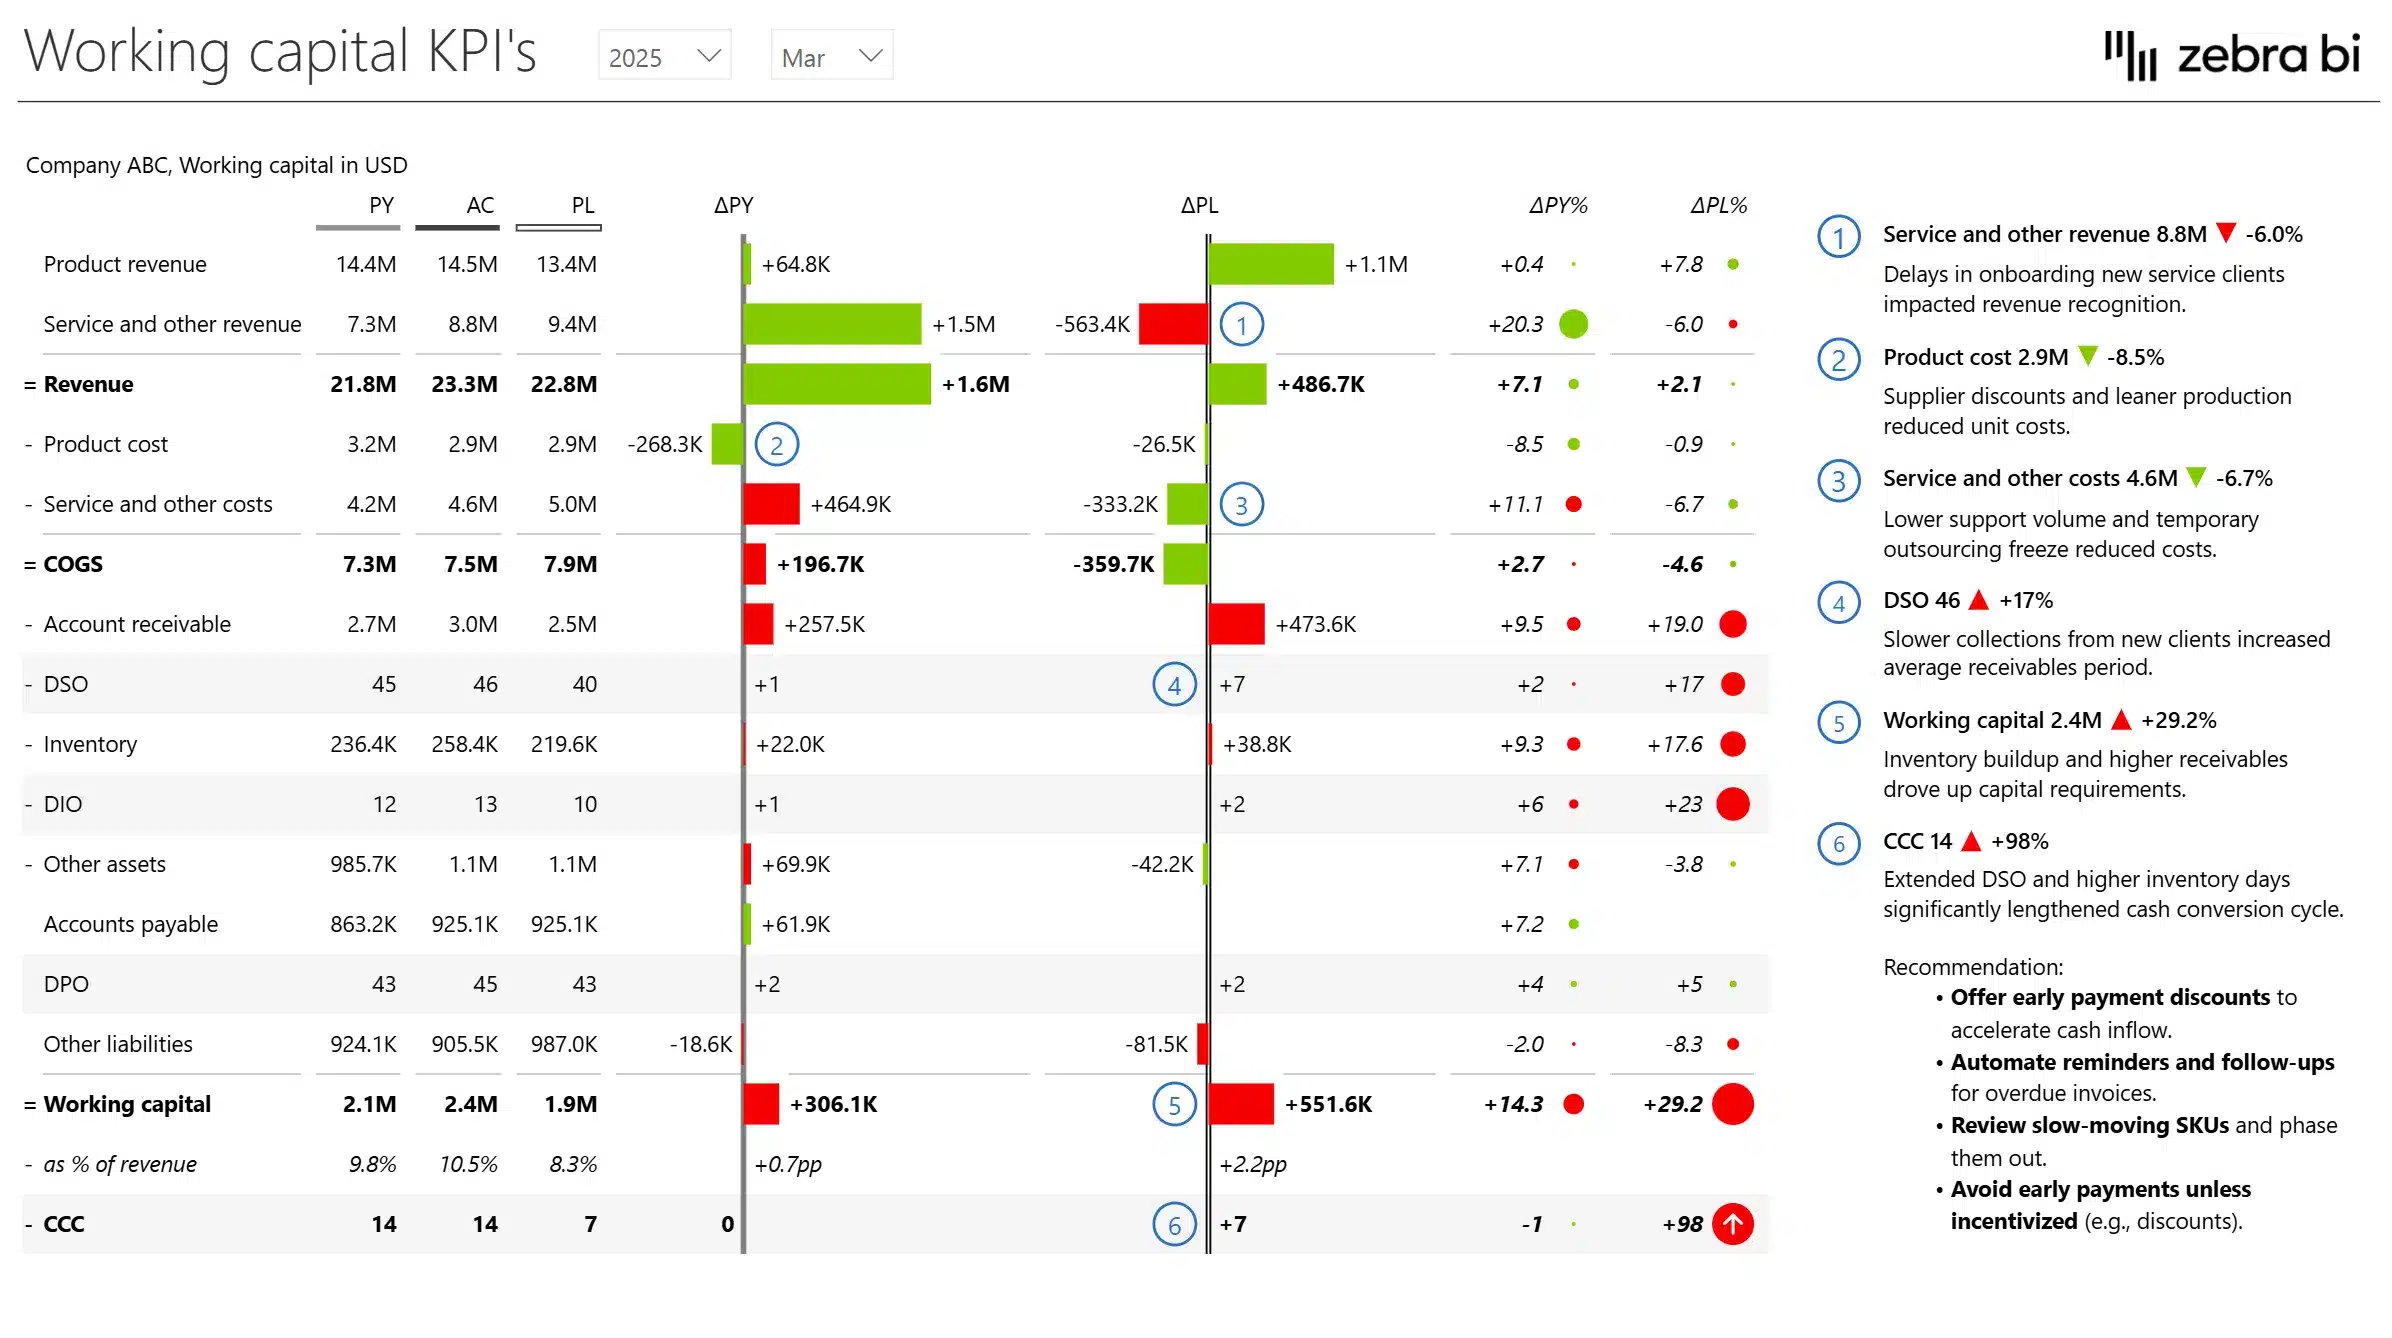
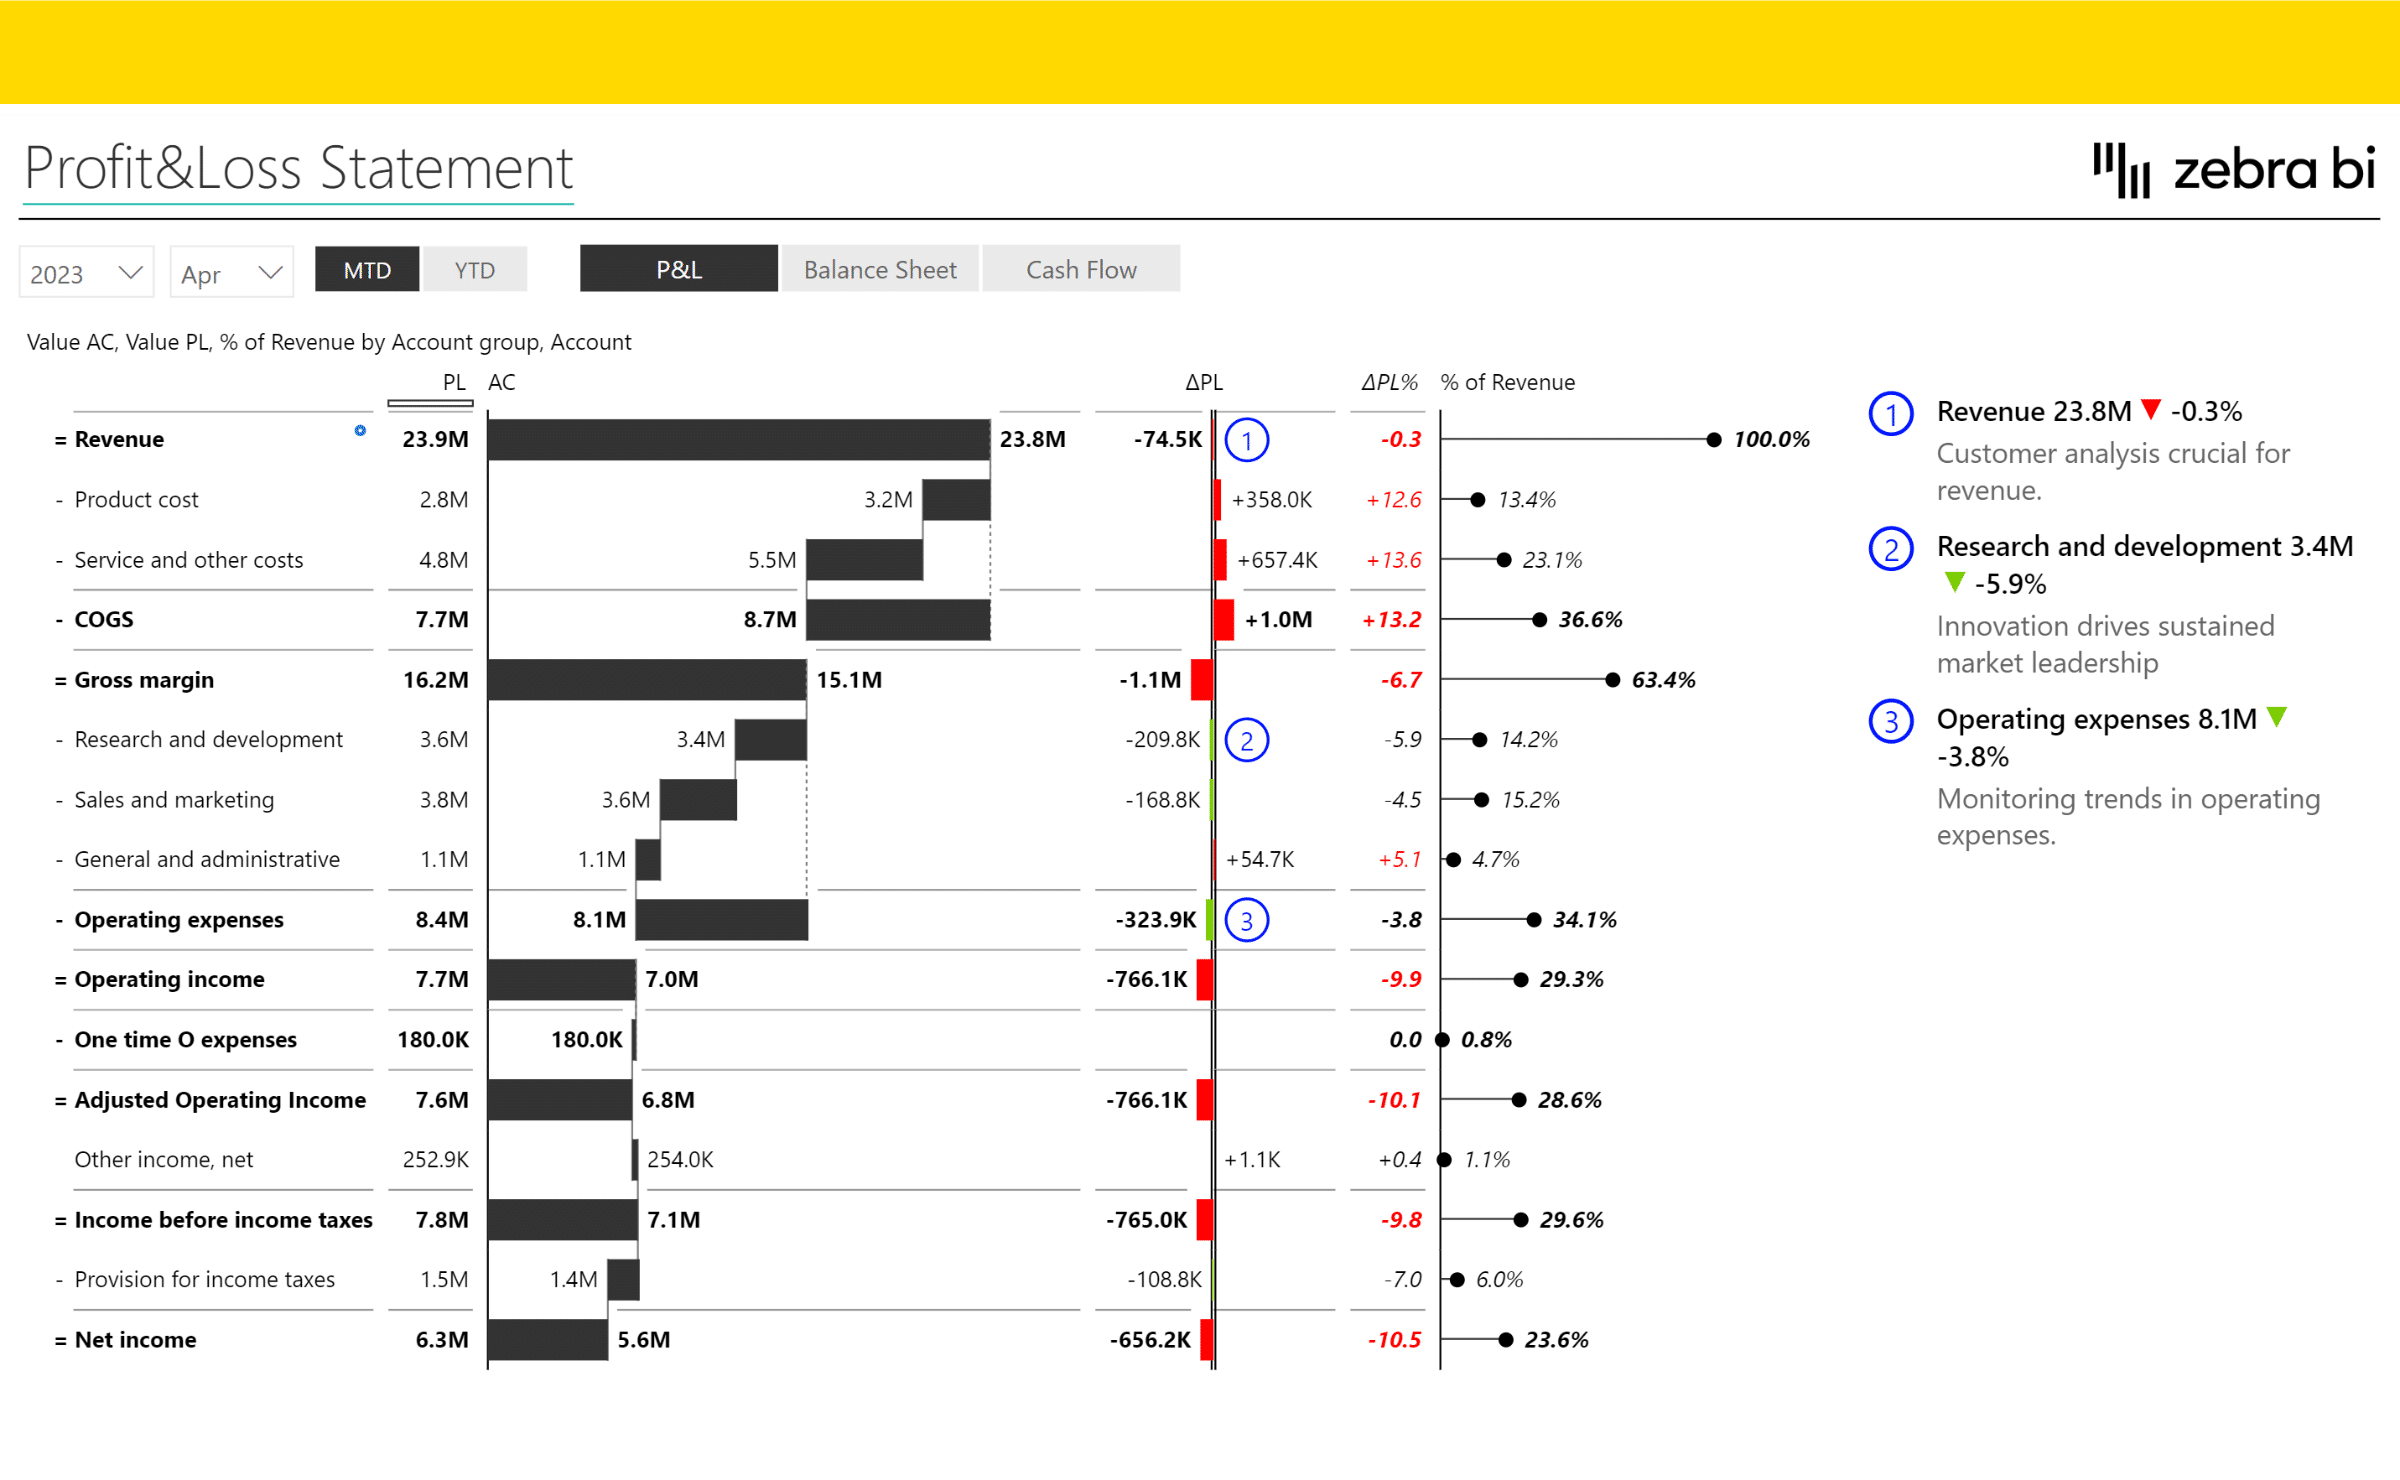
- Add context with integrated comments and variance explanations
-
- Use Case: Enrich tables with side-by-side commentary on drivers behind revenue, COGS, or OpEx changes.
-
- Benefit: Improves report clarity and reduces the need for separate documentation or spoken walkthroughs.
- Enable drill-down and custom calculations on-the-fly
-
- Use Case: Allow users to drill into cost structures or dynamically calculate margins and ratios like Operating Margin or Gross Margin %.
-
- Benefit: Empowers analysts and decision-makers to explore data flexibly without switching tools or editing data models.
IBCS compliant
All Zebra BI templates are designed using IBCS® principles and real-world reporting experience. They help you build professional reports faster, reduce manual work, and ensure your insights are clear, consistent, and actionable — every time.
Connected Templates
Looking for more templates to help you make the most out of Power BI? Our recommendations include:
› Annual Comparative Statement
This Annual Comparative Statement enables you analyze income statement data across multiple years and regions - an example how you too can turn an Excel table with financials for the past 5 years into Power BI, from an outdated table to a mean, lean, insights-generating machine
The easy to understand visual representations help you clearly identifying trends, key performance drivers, and financial patterns in a financial dashboard. It applies data visualization best practices and interactivity to support easy exploration, intuitive interpretation, and clear communication of financial performance.
› Financial Analysis & Benchmarking Power BI Report Template
The purpose of this Financial Analysis & Benchmarking Power BI report is to provide precise financial analysis and benchmarking reports. The dashboard provides industry professionals with key performance indicators (KPIs). Ideal for financial analysts, accountants, and business executives, it simplifies tracking market trends, operational efficiency, and financial health. Compare your performance against industry peers with this dynamic template to stay competitive and achieve strategic goals.
› Consolidated Financials in Power BI
This Consolidated Financials Power BI template is designed to help you make an actionable overview of financials for the management - top-level view where simplicity is key.
How It Works
Getting started is quick and easy — even if you’re not a Power BI expert.
Next steps:
- Download this power bi templates/examples to find best practices and inspiration for actionable reporting techniques.
- Use sample data to test it out and check what is the background to find application to your use cases.
- Use free trial or and other Zebra BI plan to create PVM analysis reports with Zebra BI visuals on your own data.
 September 8th
 February 22nd