Updated:

Working Capital in Power BI

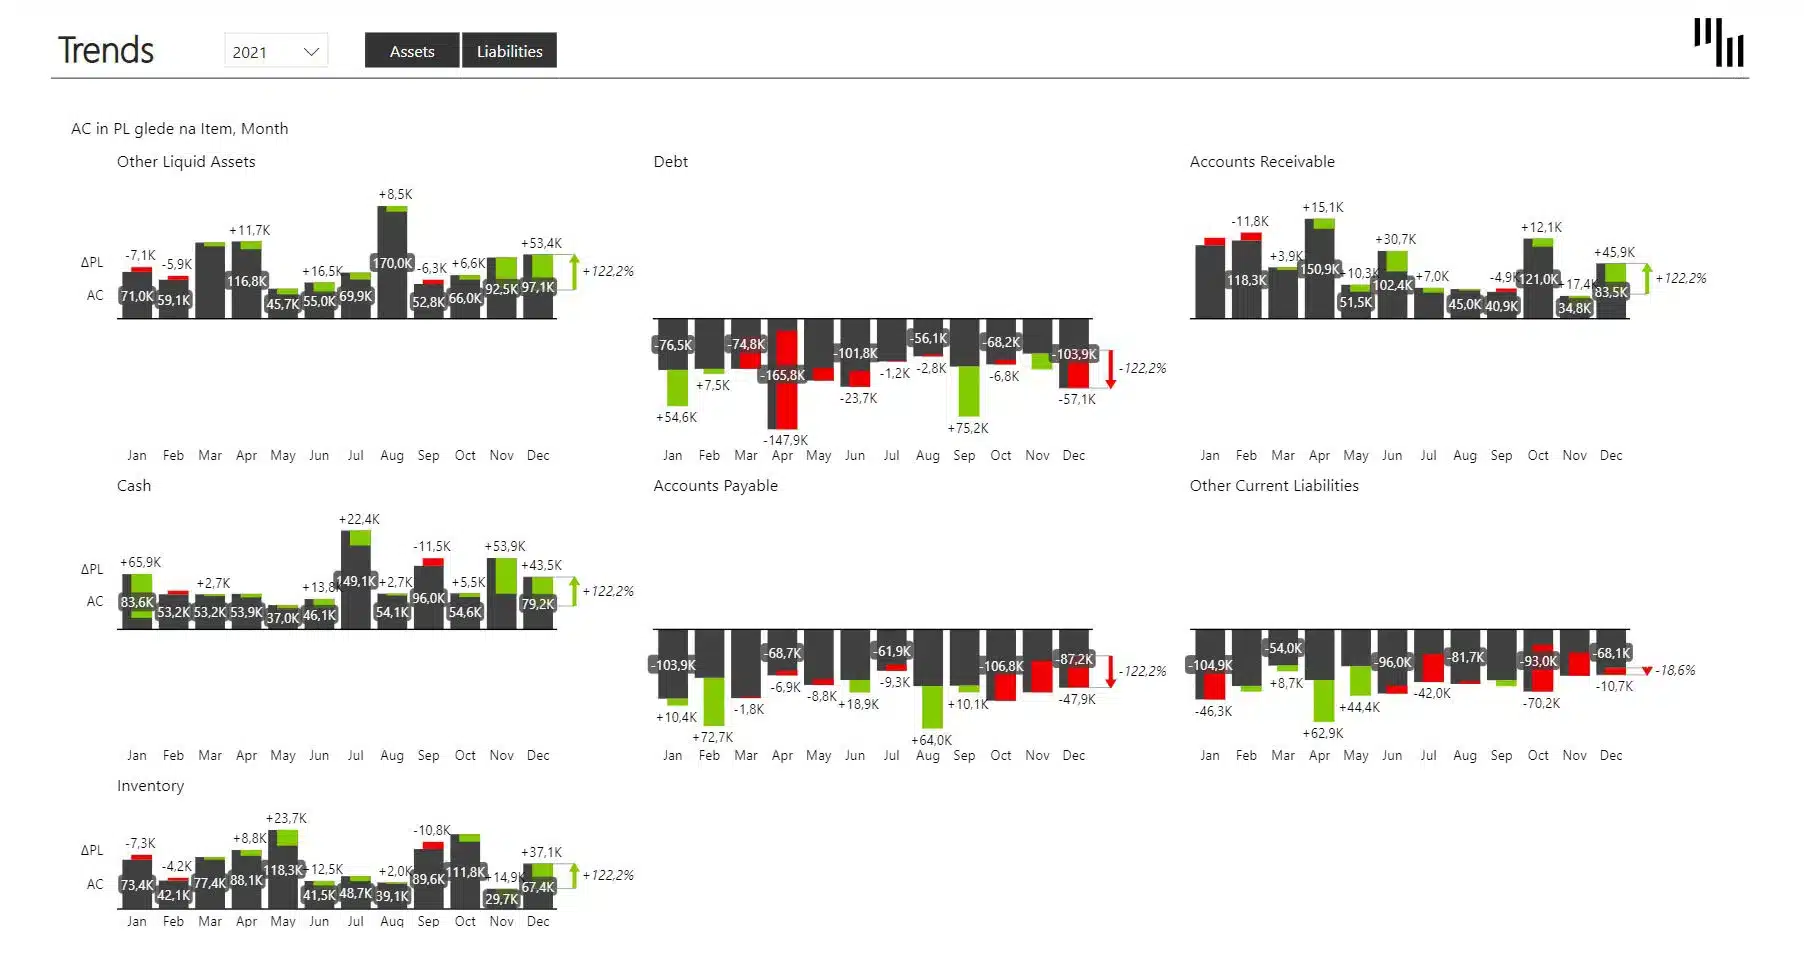
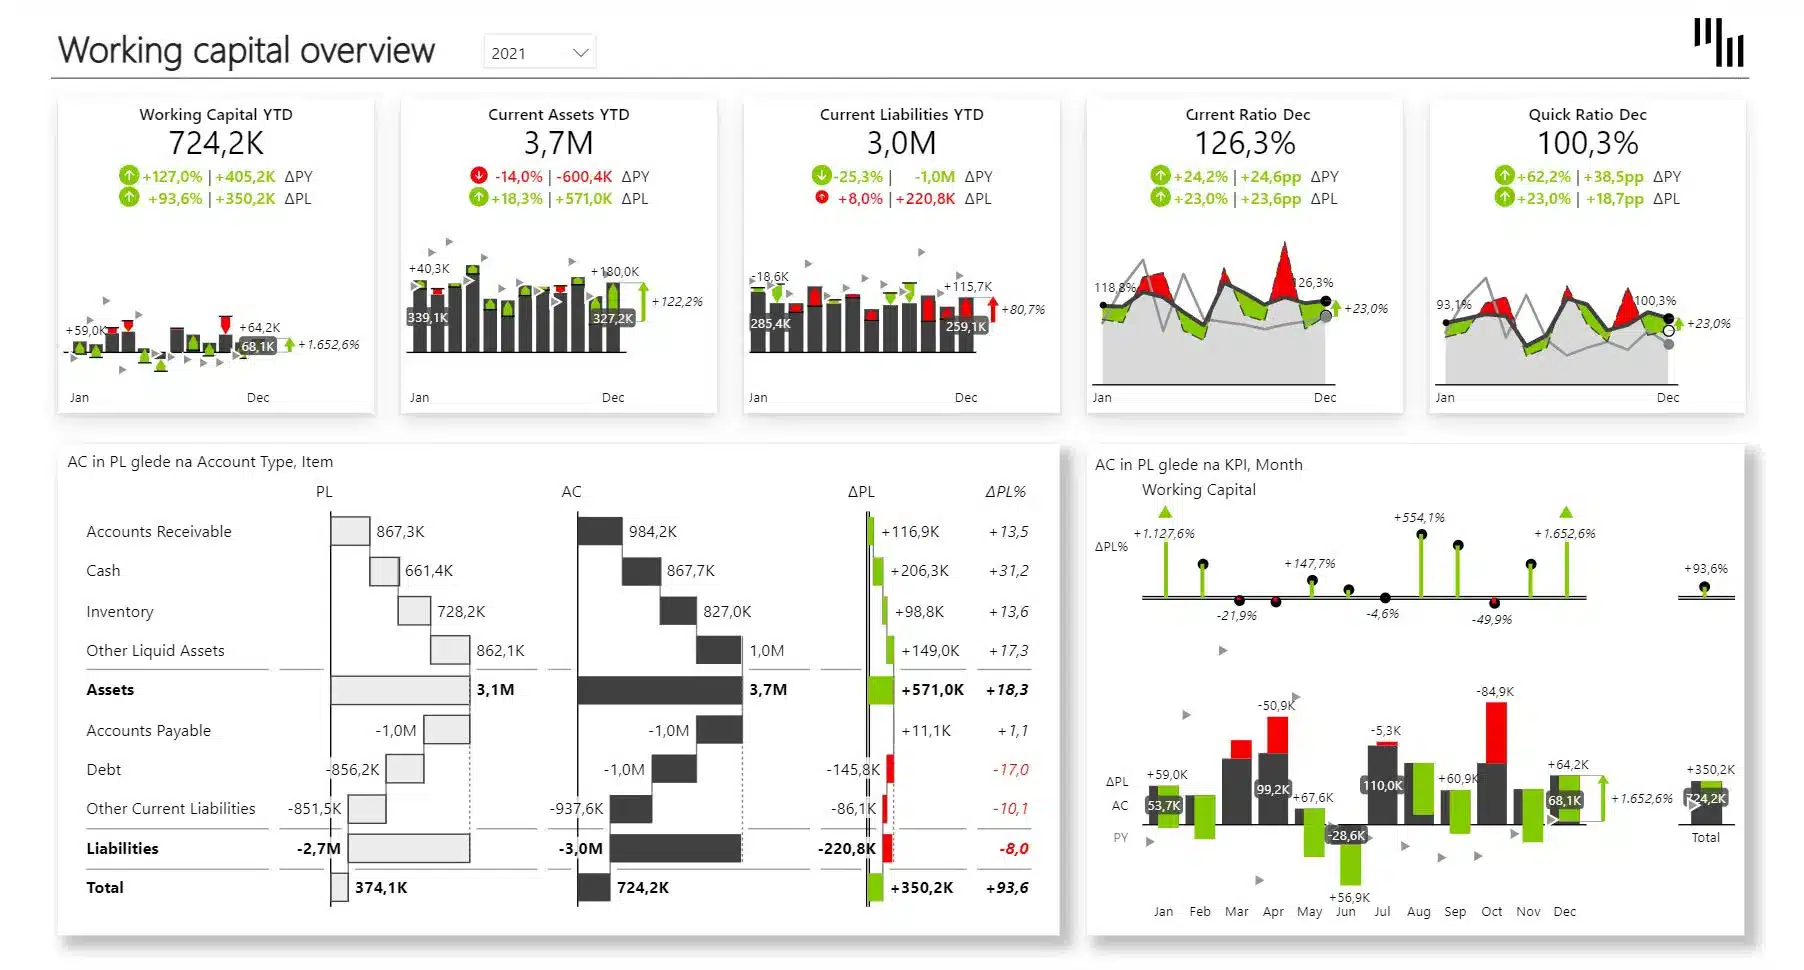
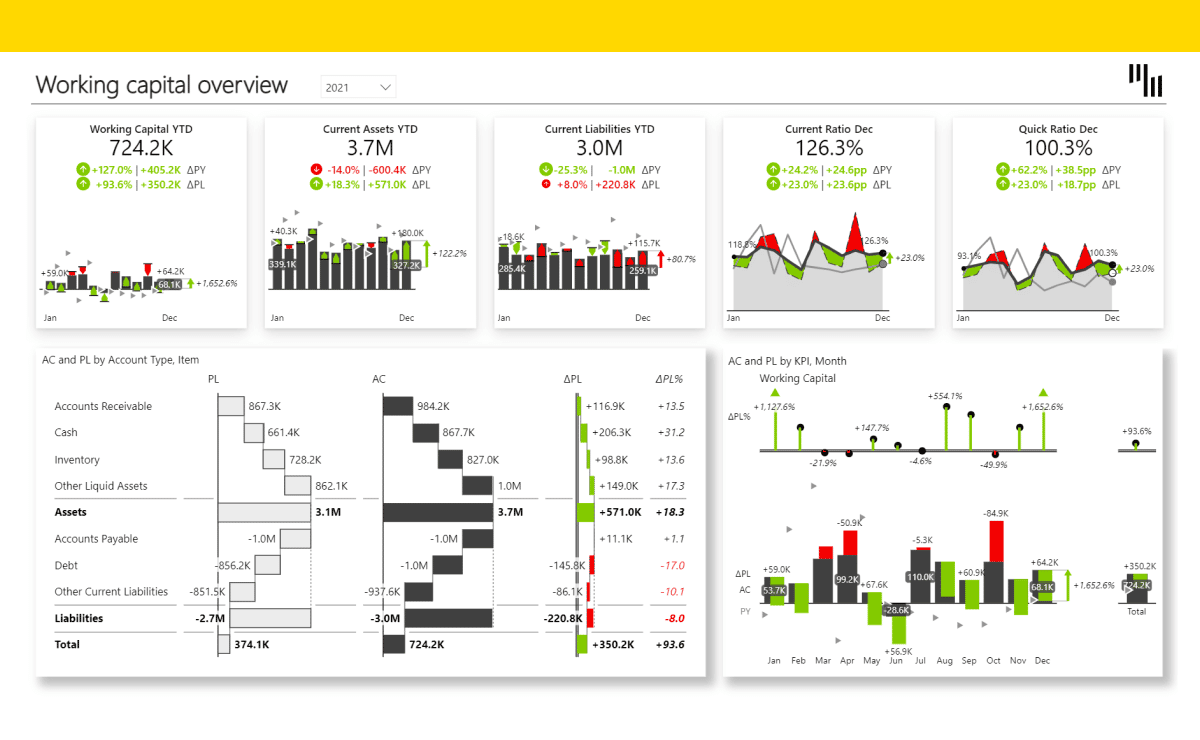
The Working Capital template for Power BI allows you to have a clear overview of the Current Assets, Current Liabilities and the difference between them - Working Capital. You can understand the balance sheet at a glance (visualized with vertical waterfall charts) and analyze the trends of each KPI.

Play with the interactive demo below. If you click the ⤢ icon at the bottom-right of the report page you'll be able to enjoy the full-screen view.

Try it in your Power BI!

Learn how we help our customers solve real challenges

April 17, 2025
How W.L. Gore used Zebra BI to make Power BI work for finance—and saved hundreds of hours 
Executive summary  W. L. Gore & Associates, Medical Products Division faced a challenge: financial reporting was manual, inconsistent and fragmented across business units. Analysts spent countless hours consolidating data from different systems, while executives struggled with lagging reports that lacked actionable insights. Adoption of Power BI was slow as finance teams found the reporting capabilities […]
Read the success story
January 14, 2025
KPN’s Reporting Transformation: From Bottlenecks to Self-Service, Flexible Dashboards with Zebra BI
The shift towards self-service exploratory self-service dashboards is revolutionizing how businesses operate by empowering users with autonomy and access to real-time data.   When KPN started leveraging Zebra BI, it enabled business users to independently access, analyze, and visualize data without relying on BI teams or report creators. This autonomy accelerated decision-making, as users could finally […]
Read the success story
August 29, 2023
5 practical tips from AbbVie on driving internal report adoption
Driving internal adoption of new reporting tools is not easy. Get practical tips from AbbVie's Senior Financial Data Analyst on how to succeed in this process.
Read the success story
Read all customer stories