Get to know Zebra BI in 15 minutes

at your convenience

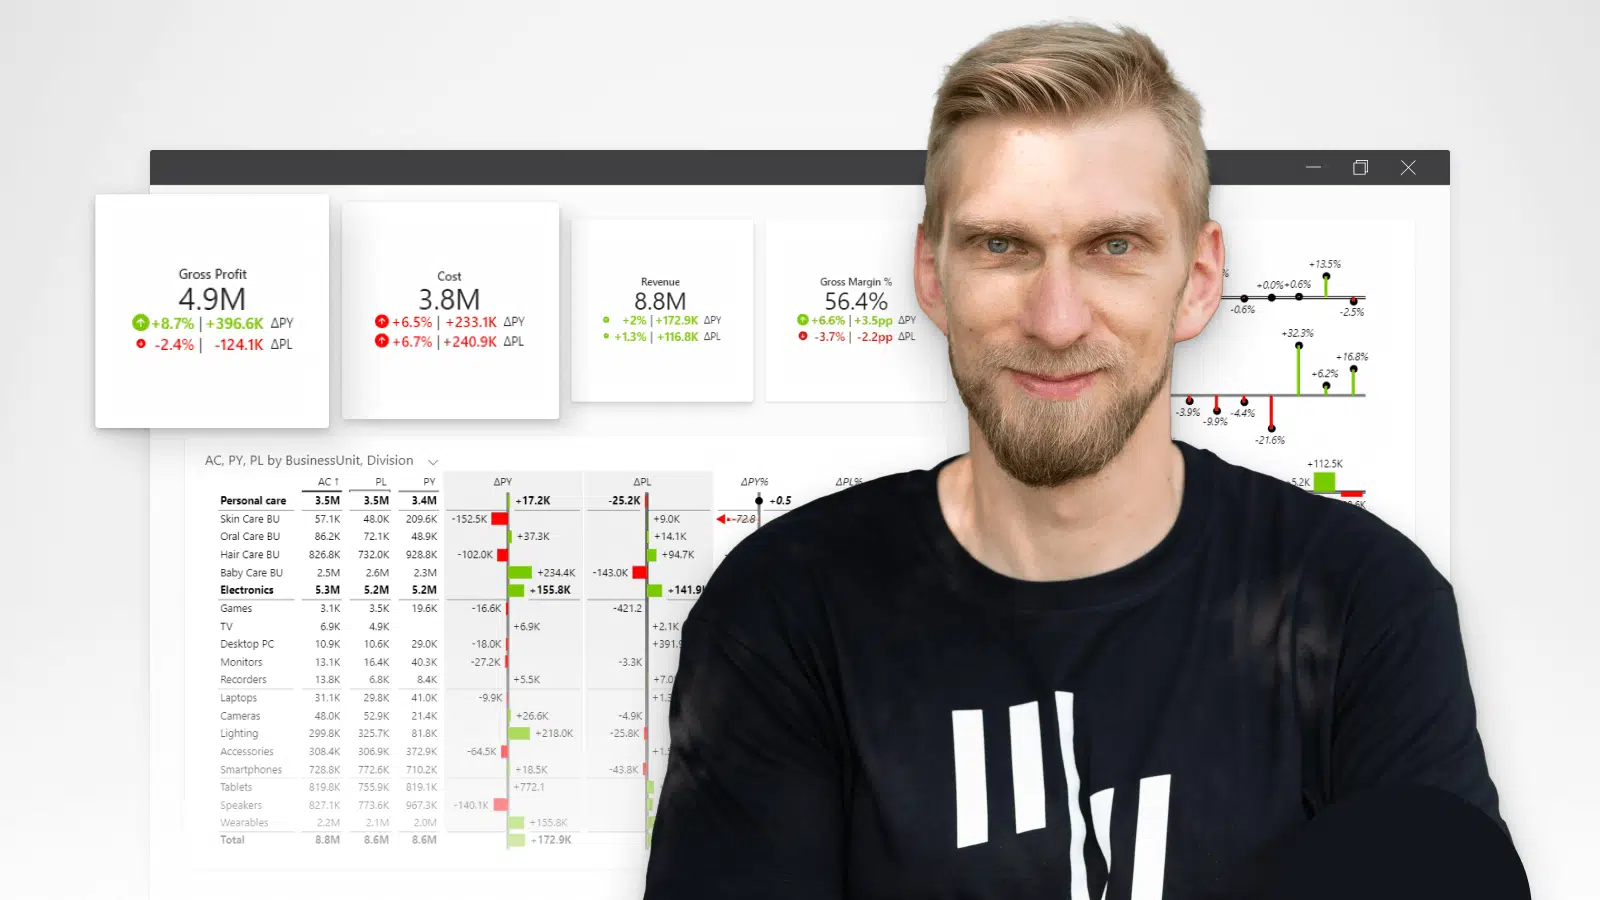
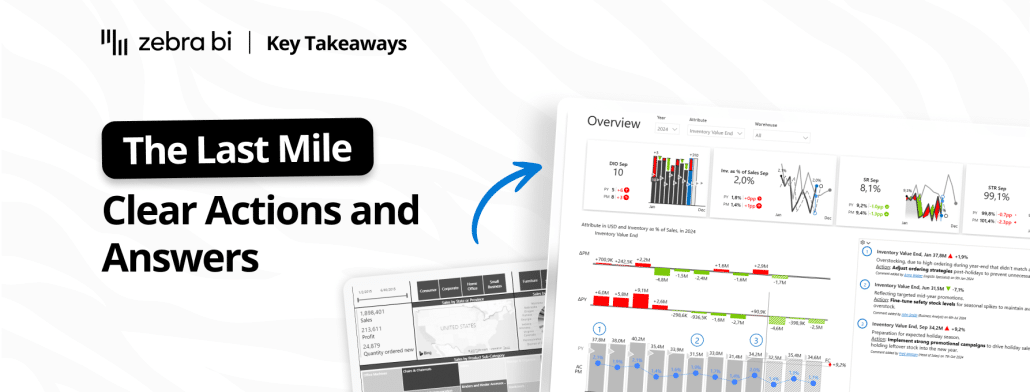
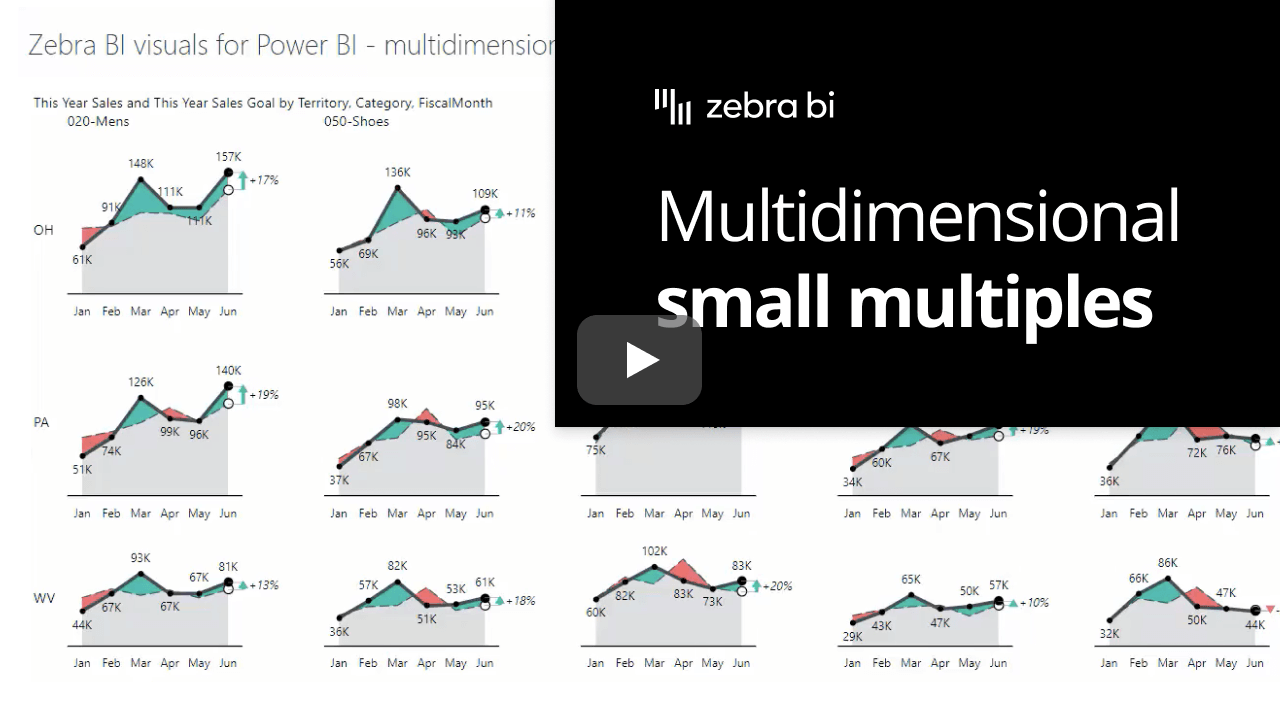
Watch the product tour and learn how the combination of report structure and functionalities can put you at the forefront of creating actionable and understandable reports. 

Watch a product tour
Knowledge Base
Learn how to use Zebra BI - from beginner to pro!
Resource Hub
Check out step-by-step tutorials, stunning templates, community events, and much more.
Report Templates
We’ve selected our top example reports for you to try out.

Zebra BI Live Product Demo

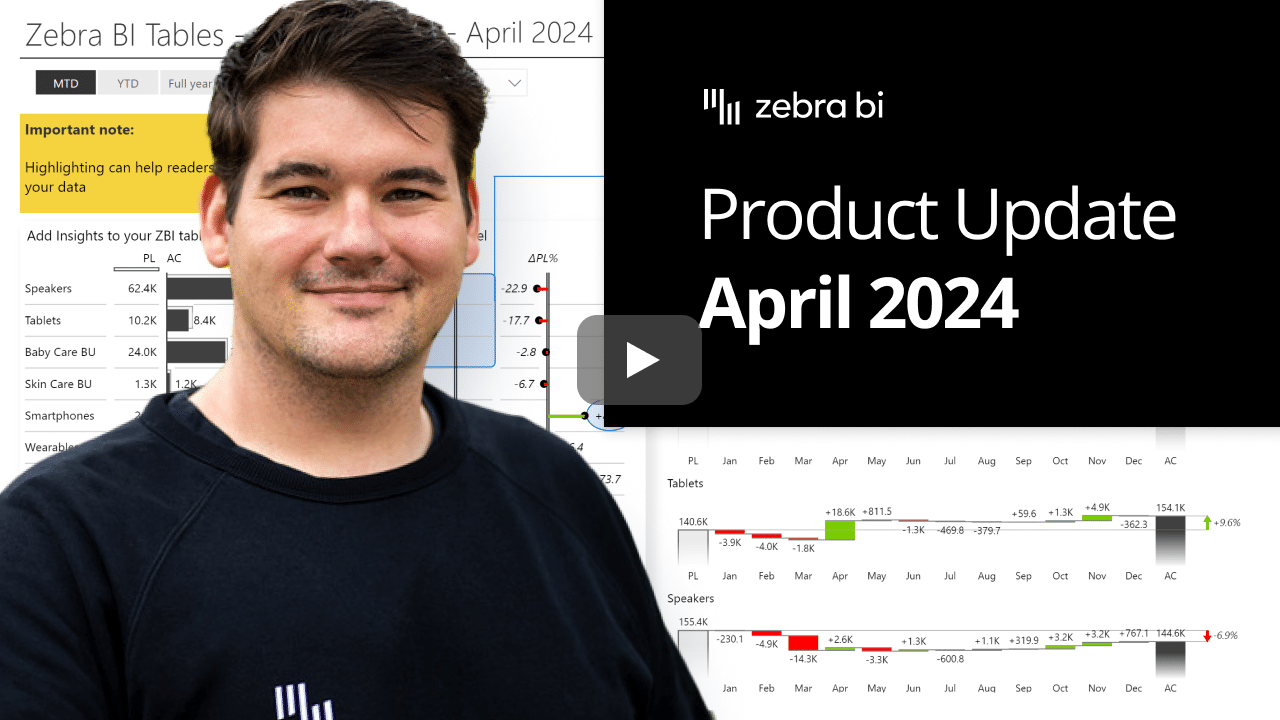
Join our BI expert Matej as he shows you how to build actionable reports with Zebra BI visuals from scratch.  

It’s super simple – see for yourself. 

Register

Top resources

June 4, 2026
Dashboards vs AI: Live Analysis of 100 S&P Company Financials
Finance teams are debating dashboards vs AI. We're not going to debate. We're going to show. On June 4, we walk through 100 real company P&Ls (Nike, Tesla, Pfizer, Walmart, Amazon) across 6 industries and 6 years of public financial data, live, in a single report. See what great financial reporting looks like at scale.
May 11, 2026
Price Volume Mix (PVM) Analysis in Excel: Step-by-Step Guide with Formulas & Examples
Learn how to do price volume mix (PVM) analysis in Excel with step-by-step formulas, a real example, and a free downloadable template.
May 8, 2026
Last Mile Analytics: The Framework, and Two Teams Who Crossed It
Eighty percent of BI investments fail to change a single decision. The gap between dashboard and decision has a name: the last mile of analytics. Inside: the four-question test from our Part 2 webinar, and two finance teams (Heijmans and Ipsen Pharma) who actually crossed it.
March 26, 2026
How teams cross the Last Mile
Your reports are ready. Decisions aren't. Learn how to close the Last Mile - live Power BI build, real client case, actionable framework. Free, 60 min.
March 11, 2026
Key Takeaways: Why BI Fails: 7 Last Mile Patterns (And How to Fix Them)
Your dashboards are live. Your CFO is still using Excel. 7 lessons on why BI fails at the last mile — and what finance teams can do about it.
February 24, 2026
From OneLake to the boardroom: Building a governed insights agent on Microsoft Fabric that produces executive-ready visuals 
Fabric handles the first 99 miles. ROI happens at mile 100. See how Zebra AI turns Microsoft Fabric data into executive-ready decisions - automatically.
Browse All Resources
Zebra BI Changelog
Browse through the latest improvements, features & bug fixes of Zebra BI custom visuals for Power BI or add-ins for Excel & PowerPoint.
See product release notes
How can we help?
In case you have any technical inquiries or concerns please contact our support team. We'll be happy to help.